The 11 "Death Spiral" States
Submitted
by Tyler Durden
on 12/04/2012
http://albertpeia.com/deathspiralstates.htm
‘Eleven states made Forbes' list of danger spots for investors
including California, New York, Illinois, and Ohio. They warned (and with
the cliff it is even more critical), if you have muni bonds in these
states - clean up your portfolio; if your career takes you there - rent, don't
buy! Two factors determine their list of 'fiscal hellholes'. The first is
whether there are more takers (someone who draws money from the
government) than makers (the gainfully employed). The second is a state credit-worthiness score (via Conning)
based on large debts, uncompetitive business climates, weak home prices, and
bad trends in employment. Conning rates North Dakota the safest state to lend
money to, Connecticut the most hazardous. A state qualifies for the Forbes' death
spiral list if its taker/maker ratio exceeds 1.0 and it resides in the bottom
half of Conning’s ranking. See below for the 11 states to avoid...no
matter what Bob Toll, Larry Yun, Bob Pisani, or Alexandra Lebenthal tells you..
Eleven states made Forbes' list of danger spots for investors
including California, New York, Illinois, and Ohio. They warned (and with
the cliff it is even more critical), if you have muni bonds in these
states - clean up your portfolio; if your career takes you there - rent, don't
buy! Two factors determine their list of 'fiscal hellholes'. The first is
whether there are more takers (someone who draws money from the
government) than makers (the gainfully employed). The second is a state credit-worthiness score (via Conning)
based on large debts, uncompetitive business climates, weak home prices, and
bad trends in employment. Conning rates North Dakota the safest state to lend
money to, Connecticut the most hazardous. A state qualifies for the Forbes' death
spiral list if its taker/maker ratio exceeds 1.0 and it resides in the bottom half
of Conning’s ranking. See below for the 11 states to avoid...no matter
what Bob Toll, Larry Yun, Bob Pisani, or Alexandra Lebenthal tells you..
Number 11 -
Ohio Taker ratio: 1.00
The battleground state has a fiscal standoff between takers (people collecting
welfare, a government salary or a government pension) and makers (private
sector employees).

Number 10 -
Hawaii Taker ratio: 1.02
Dark clouds over Waikiki Beach: Hawaii has slightly more takers than makers.

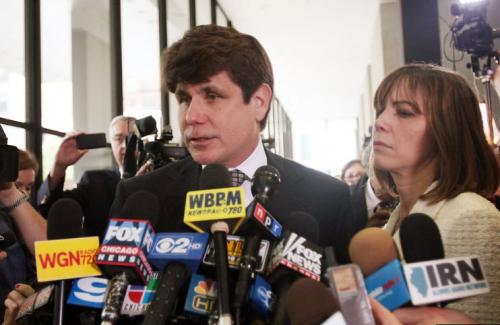
Number 9 - Illinois Taker ratio: 1.03
Dubious ex-gov Rod Blagojevich personifies what's wrong with this state: Too
many goodies promised to insiders. Unfunded pensions contribute to the balance
of 103 takers to every 100 makers.
Number 8 -
Kentucky Taker ratio:1.05
Twilight in Lexington. People drawing from government slightly outnumber people
chipping in with private-sector jobs.

Number 7 -
South Carolina Taker ratio:1.06
Riptides on Folly Beach.

Number 6 - New
York Taker ratio: 1.07
Blackout in the Flatiron district after the hurricane. Manhattan still has a
vibrant financial sector. Manufacturing there is extinguished. Causes: taxes,
unions, regulations and cheap apparel workers abroad.

Number 5 -
Maine Taker ratio: 1.07
Casco Bay,
Portland. This is a state with a beautiful coastline and a ratio of 107 drawers
from the public fisc to every 100 contributors.

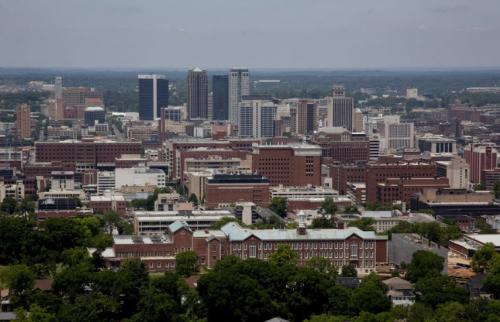
Number 4 -
Alabama Taker ratio: 1.10
Cityscape seen from
the Vulcan statue in Birmingham.
Number 3 -
California Taker ratio: 1.39
California is
generous to a fault, at least to state employees and the needy. To private
sector employees, who are outnumbered, it is not so hospitable.

Number 2 -
Mississippi Taker ratio: 1.49
Flooding near
Tunica in May 2011. The state ranks second to worst on the list of states
burdened by a high ratio of takers (welfare recipients and state employees) to
makers (private sector workers).

And The Worst
State to live in or lend to is...
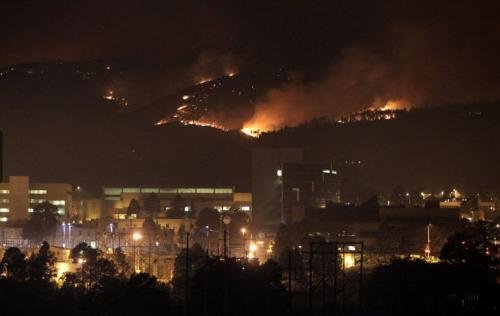
Number 1 - New
Mexico Taker ratio: 1.53
Wildfire near the
Los Alamos Laboratory in June 2011. In our taker/maker ratio, federal employees
are excluded from the taker count since their cost is not borne locally. That
doesn't save this state from having the worst ratio in the nation.
As Forbes advises:
To lend money to California, Illinois or the
other nine states perched on the precipice requires a leap of faith.
So does buying a house in those locales. Don’t count on a property tax
limit to protect your home’s value. If other taxes are high enough,
there won’t be any buyers.
Source: Forbes
-----
Worst-run states
New Jersey
Between
2010 and 2011, New Jersey’s GDP contracted by 0.5% — more than all but three
states. The state’s median household income and poverty rate both ranked third
in the nation. On the other hand, the state’s tax burden on its residents was
second highest in the U.S. in 2010. Residents paid 12.4% of their income in
state and local taxes — higher than any other state except neighboring New
York. The state has budget problems, as well, according to the 24/7 Wall St.
analysis. New Jersey’s debt as a percentage of revenue was 91.6%, the
fifth-highest of all states.
46. New Jersey
> Debt per capita: $6,944 (5th highest)
> Budget deficit: 38.2% (4th largest)
> Unemployment: 9.3% (14th highest)
Between 2010 and
2011, New Jersey’s GDP contracted by 0.5%, more than all but three other
states. The state’s median household income and poverty rate were both third
best in the nation. On the other hand, the state’s tax burden on its residents
was second highest in the U.S. in 2010. Residents paid 12.4% of their income in
state and local taxes, higher than any other state except New York. The state
has many budget problems, as well. New Jersey’s debt as a percentage of revenue
was 91.6%, the fifth-highest of all states.
Read more: The Best and Worst Run States in America: A Survey of All 50
- 24/7 Wall St. http://247wallst.com/2012/11/27/the-best-and-worst-run-states-in-america-a-survey-of-all-50/#ixzz2E9DaPrha