Jeff Reeves's Strength in Numbers Archives | Email alerts
March 18, 2013, 8:03 a.m. EDT
Editor’s
note: This column is the first in a two-part series. Part two will publish
Tuesday and detail the market’s bullish signs.
ROCKVILLE,
Md. (MarketWatch) — ‘As U.S. stocks hover at record highs, many investors
rightly wonder if the rally will last.
Unfortunately,
it may not.
MarketWatch’s
Jonathan Burton discusses what individual investors can learn from Warren
Buffett’s investment style. (Photo: AP)
Don’t take
my word for it. Check out these 10 negative headlines and economic data points
that could trigger a 5% to 10% downturn over the next several months.
Feel free
to share your own observations below. And for balance, check back Tuesday for
10 reasons the market could move even higher.
And join
me online at 2 p.m. Eastern on Tuesday, March 19 for a live Twitter debate on
the topic. Submit your comments on either the bull or the bear case to me at @JeffReevesIP and use the hashtag
#bullorbear in your tweets.
As
investors recently saw with Apple AAPL +2.72% , a shortage of buyers
means a shortage of upside. The broader market shows similar strain.
A great
report (and chart) from Chris Kimble in early March indicated that cash in
investor accounts were approaching the barest levels ever. Not only does this
suggest a scarcity of buyers, it is ominous because low cash levels preceded
both the 2000 and 2008 market collapse — and the 2011 mid-year contraction.
The
price-to-earnings ratio of the Standard & Poor’s 500-stock index SPX -0.55% is a bit rich at
almost 18, vs. a mean of 15.5 and a median of 14.5 for the market historically.
Not only
is that expensive, but a broader and well-respected measure of valuation known
as P/E10 (or Shiller P/E ratio)
is hinting at an overbought market. Read
more: What Shiller P/E ratio says about the stock market.
In a
nutshell, Shiller P/E uses inflation-adjusted earnings across 10 years to
determine valuation and avoid short-term noise affecting the data. And right
now, that P/E is around 23, vs. a historical average of about 16. Furthermore,
the pre-recession peak of the market in late 2007 boasted a Shiller P/E of
around 28. So using both short-term and long-term data, the market appears to
be slightly overbought.
Speaking
of Shiller, when you start getting targets like Dow
18,000 and Dow
36,000, it’s time to worry about that old feeling of “irrational
exuberance,” don’t you think? Read
more: Alan Greenspan vs. Bill Gross on 'irrational exuberance' part 2.
The major
indices have been hitting new highs, but it’s important to note that important
sectors including energy and materials remain behind, with about two-thirds of
stocks in these sectors pushing above their 50-day moving averages.
Notable laggards
include metals stocks Alcoa AA -0.81% , U.S. Steel X -0.49% and Freeport
McMoRan Copper & Gold FCX -0.80% , along with and energy
plays Occidental Petroleum O -0.67% , Noble Energy NBL -0.69% and Devon Energy DVN -0.16% .
Each of
these stocks traded below their 50-day moving averages as of Friday — meaning
that, on the whole, they are priced lower now than where they have typically
been trading during the last two months. That tends to signal downward
momentum.
The 7.7%
unemployment rate is a four-year low and has people excited about a recovery.
But the recovery is still painful, with millions of Americans out of work and
millions more underemployed in low-earning jobs. As Dean
Baker of The Guardian points
out, a strong winter prefaced a dismal spring for job creation in the past few
years. So let’s not set off fireworks for employment growth just yet.
New highs
for the major indices are frequently short-lived. Sam Stovall, chief equity
strategist at S&P Capital IQ, told USA
Today ’s Adam Shell that across 11 bull markets since World
War II, “The S&P 500 tacks on an additional median gain … of only 3% in the
two months after eclipsing an old high, before heading lower and suffering a
decline of 5% or more.”
GDP
growth for 2012 totaled 2.2%, a pickup from 1.8% growth in 2011. Most Wall
Street experts aren’t predicting much improvement for this year. Can we really
have a sustained bull run with such poor numbers? Also, remember that the
market ended flat in 2011 after a big surge through spring.
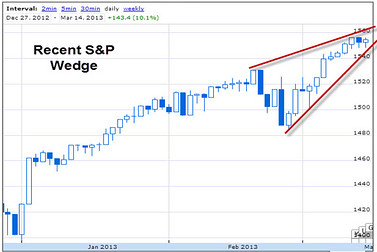
The
technical analysis crowd is talking a lot about the current “rising wedge”
pattern in the S&P 500 — an extremely bearish chart that typically precedes
a breakdown. A rising
wedge chart is characterized by an uptrend in prices but more importantly an
increasingly tight range at the point of the “wedge” where buyers lose momentum
even if sellers haven’t taken the reins just yet. Both the
long-term and the short-term trends indicate the bearish wedge pattern, and the
lack of significantly higher highs and extremely low volume lately may be
hinting that these prices are not sustainable. Here’s a
crazy figure for you: The first time gasoline prices fell in 2013 was March
8. That’s more than two straight months of rising prices. This trend
was mirrored in an ugly fact of last week’s retail sales: More than half the
rise in spending was due to higher prices at the pump, not discretionary sales.
In fact, excluding gasoline, sales were up 0.6%
instead of 1.1%. Separately,
a CPI report indicated a 9.1% rise in gasoline, causing the highest jump in the
inflation index since 2009. Read
more: Inflation hits highest level in more than three years. Add to
this the fact that a stronger
U.S. dollar will keep a floor under crude oil prices and we could be headed
for painfully elevated energy prices in 2013 — which could be bad for consumer
spending and bad for fuel-sensitive businesses. Read
more: Natural gas is commodity market's sleeping giant. As a
recent Comstock
Partners note bluntly puts it, “Rosy forward-looking earnings forecasts
that come crashing down are nothing new for the market.” Be careful of
thinking that stocks are cheap based on forward projections that can and will
move downward. The same goes for macro data, too; after all, we were
in a recession and didn’t even know it thanks to poor GDP forecasting and
understatement of the true decline. So before you read too much into better
forecasts for the second half of 2013 or into 2014, remember how quickly things
can change. There you
have it: A journey into the market’s danger zones. Again, please weigh in with
your comments and I will respond where I can. ‘ ‘Coming Tuesday: Read about the market’s
bullish signs and join the conversation on Twitter at 2 p.m. ET by messaging
Jeff Reeves at @JeffReevesIP.
And tag your tweets with the hashtag #bullorbear. Jeff Reeves is editor of InvestorPlace.com and author of
“The Frugal Investor’s Guide to Finding Great Stocks.” Write him at editor@investorplace.com or follow
him on Twitter: @JeffReevesIP. As
of this writing, he did not own a position in any of the stocks named here. ‘
9. Gasoline prices
10. Winds of change