Property Values Projected to
Fall 12% in 2010
Michael David White
NewObservations.net
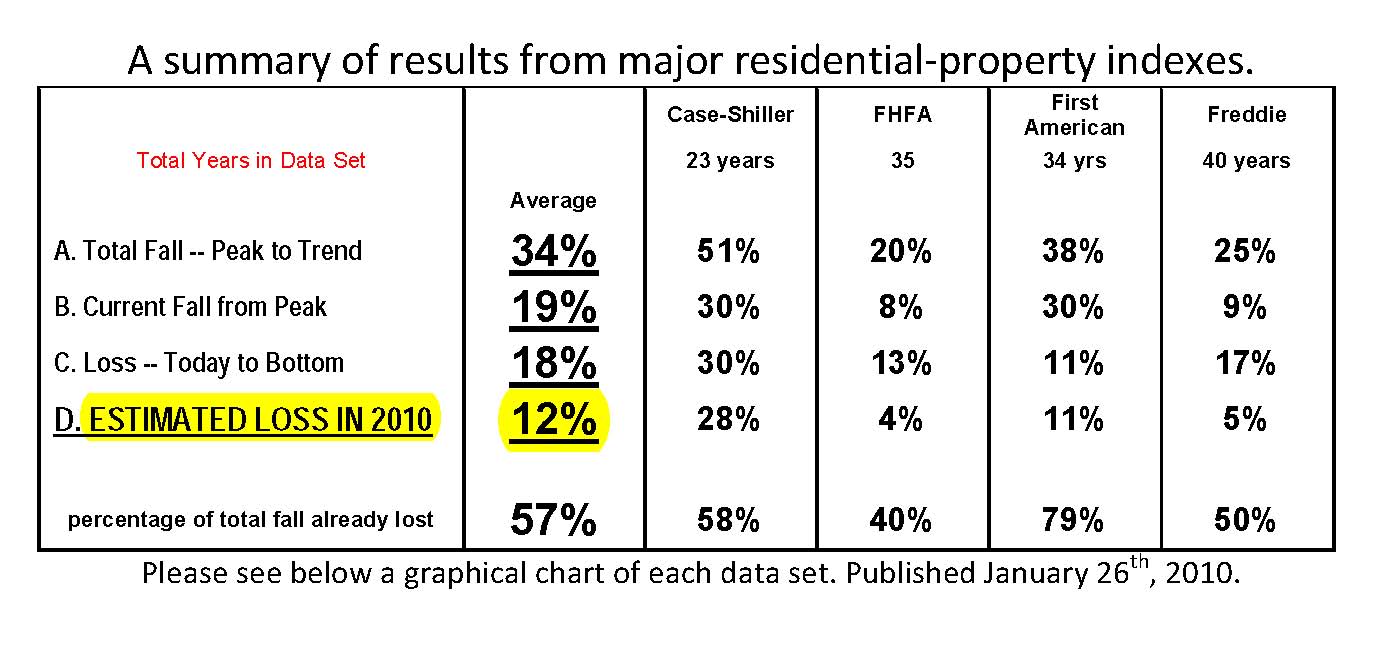
projects residential real estate prices will fall 12 percent nationwide in
2010.
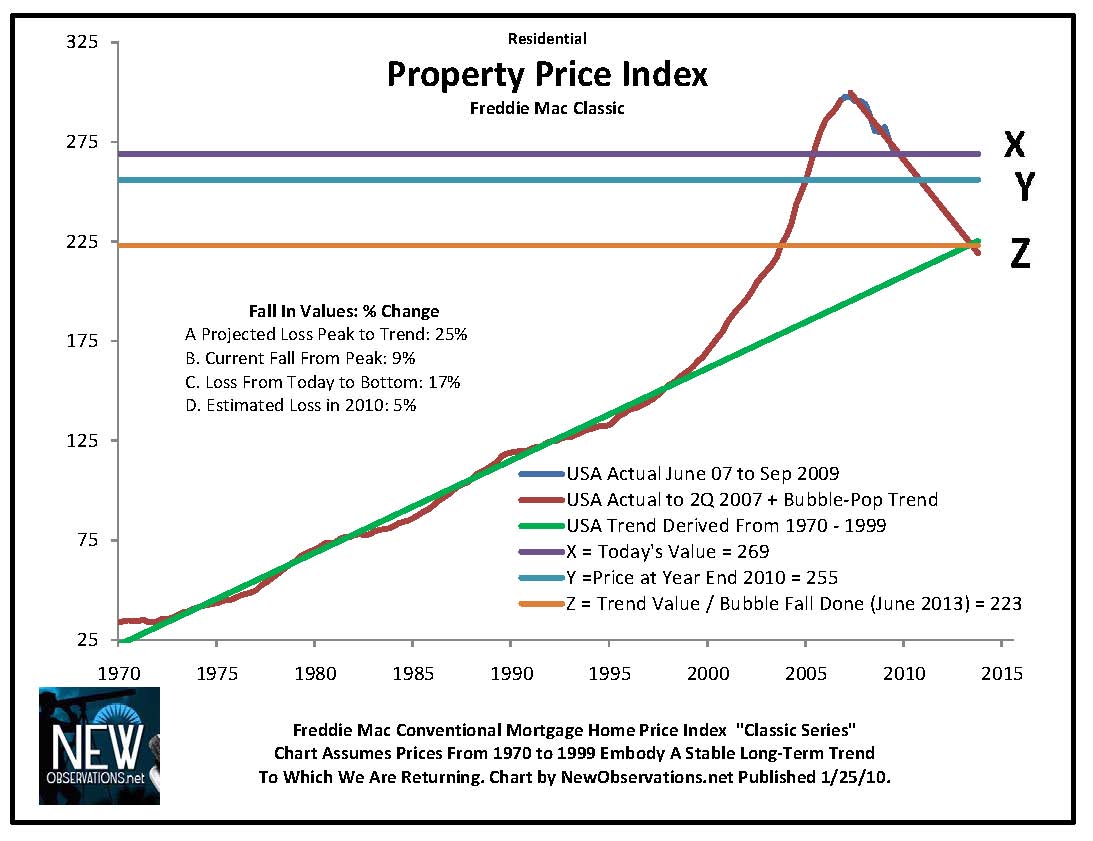
Our average of four major
indexes predicts a total fall in prices of 34% from peak to stable trend. The
total fall of 34% is based upon a current loss across four number sets of 19%.
The timing and the total
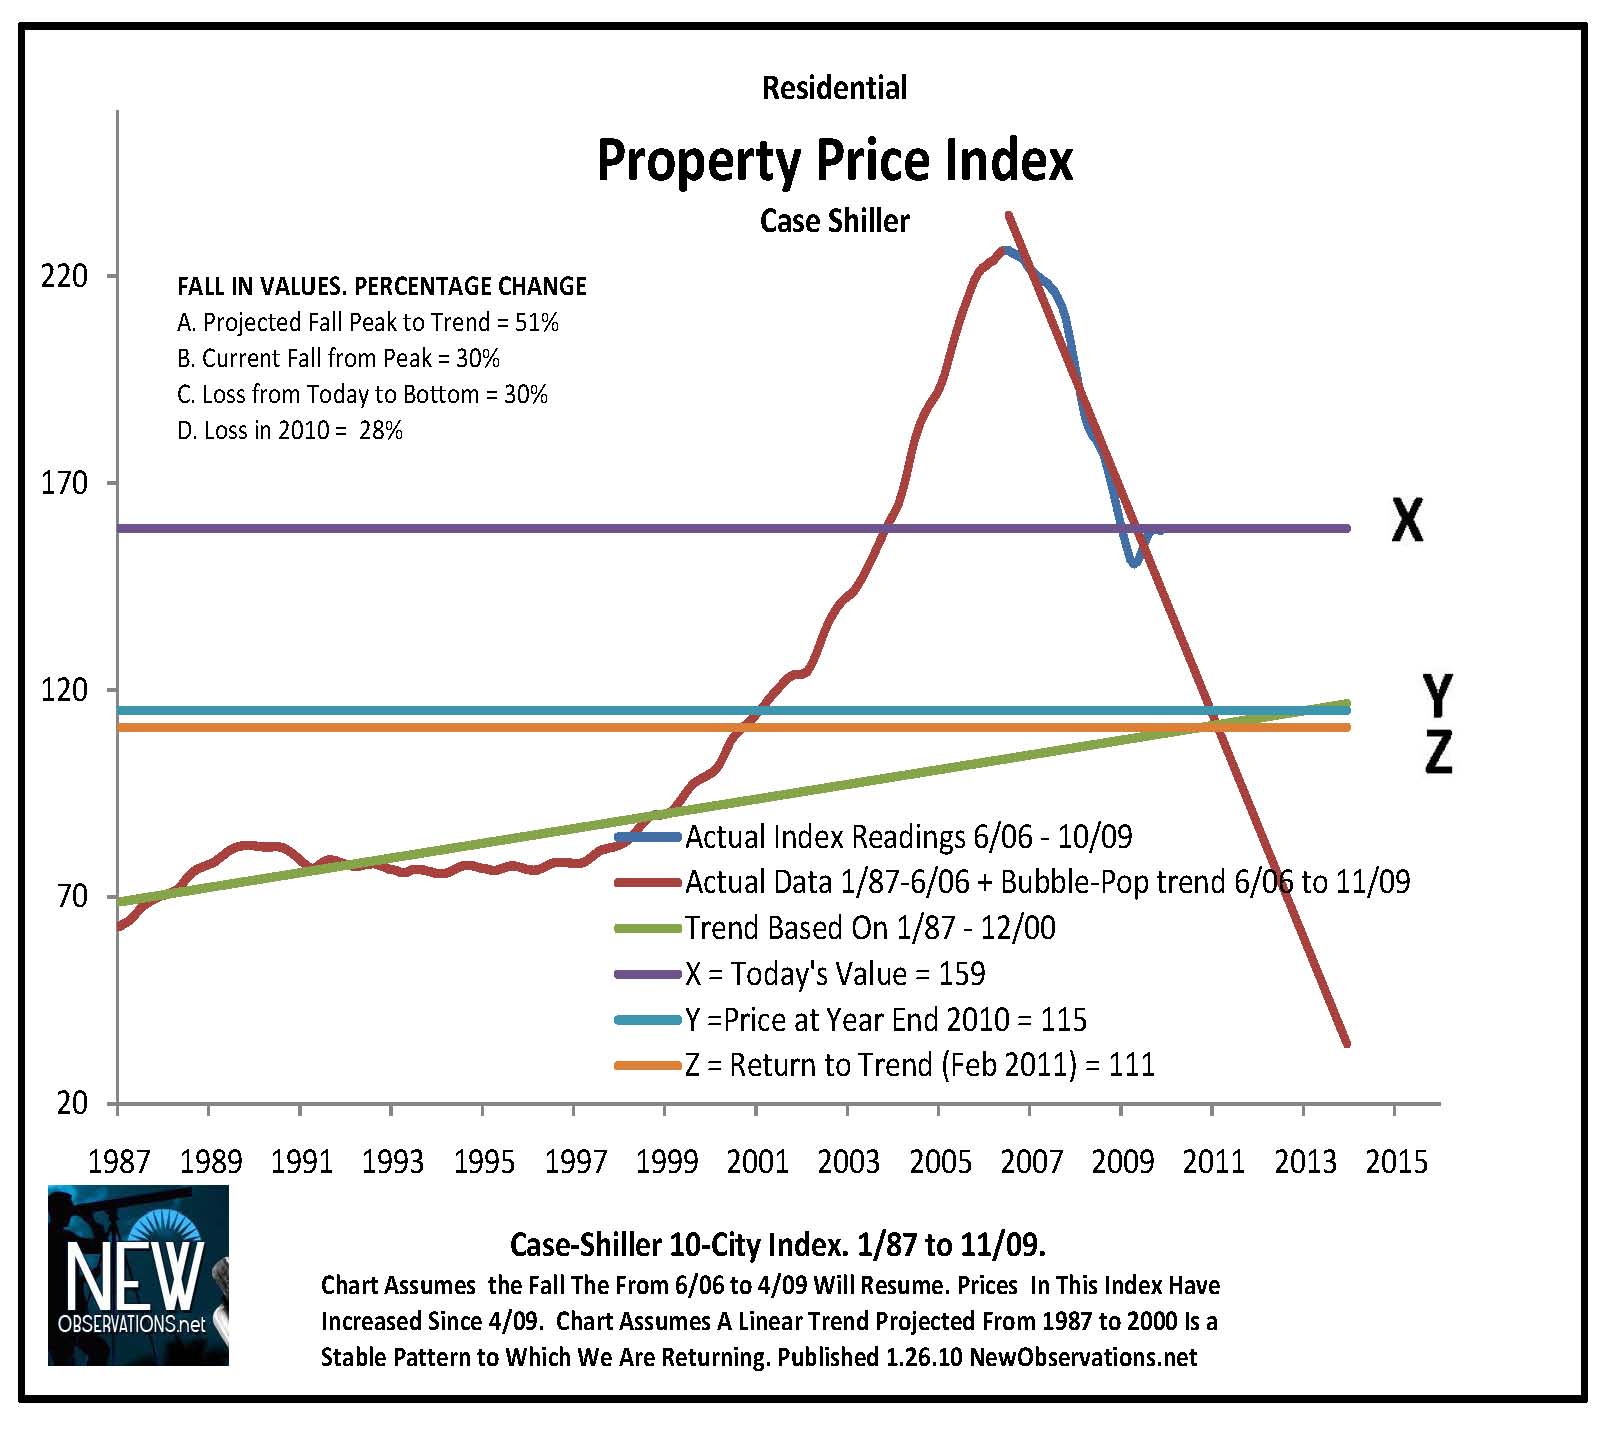
fall vary widely among the data. The most conservative picture of our total
fall is a 20% loss. The most radical prediction is that values will fall 51%
from peak to stable trend (Please see the summary of results immediately
below.).
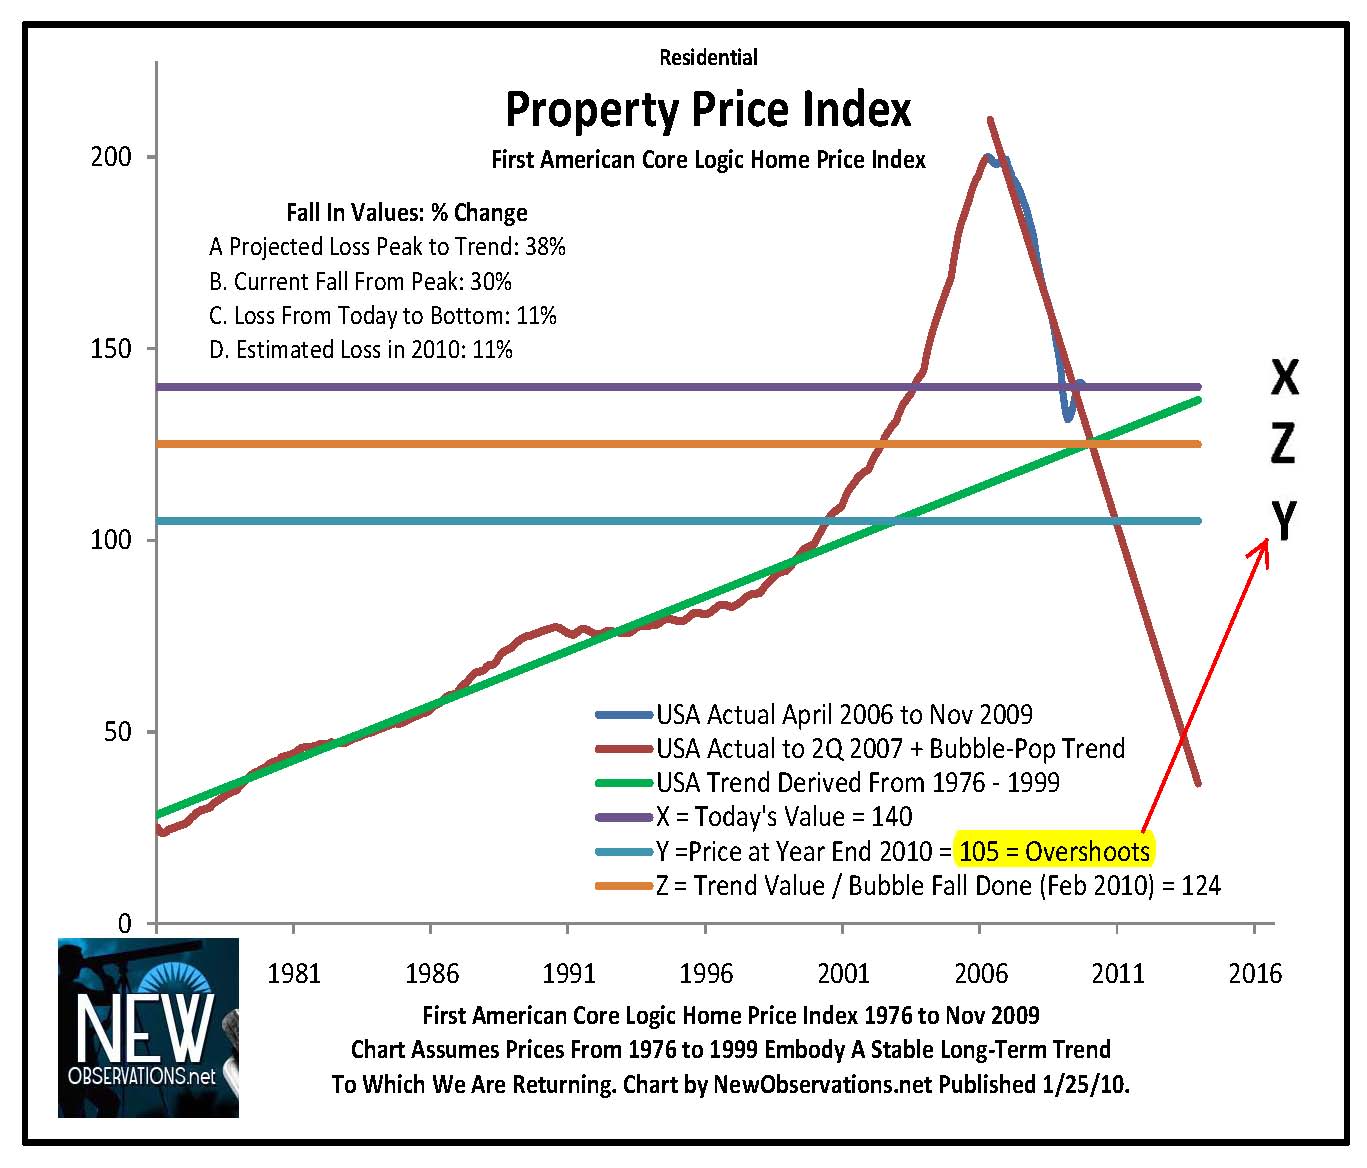
One data set predicts that
we will attain a trend value this year and then push beyond it (See below the
First American Core Logic Chart.). The projections provided here artificially
limit the loss to a return-to-trend value.
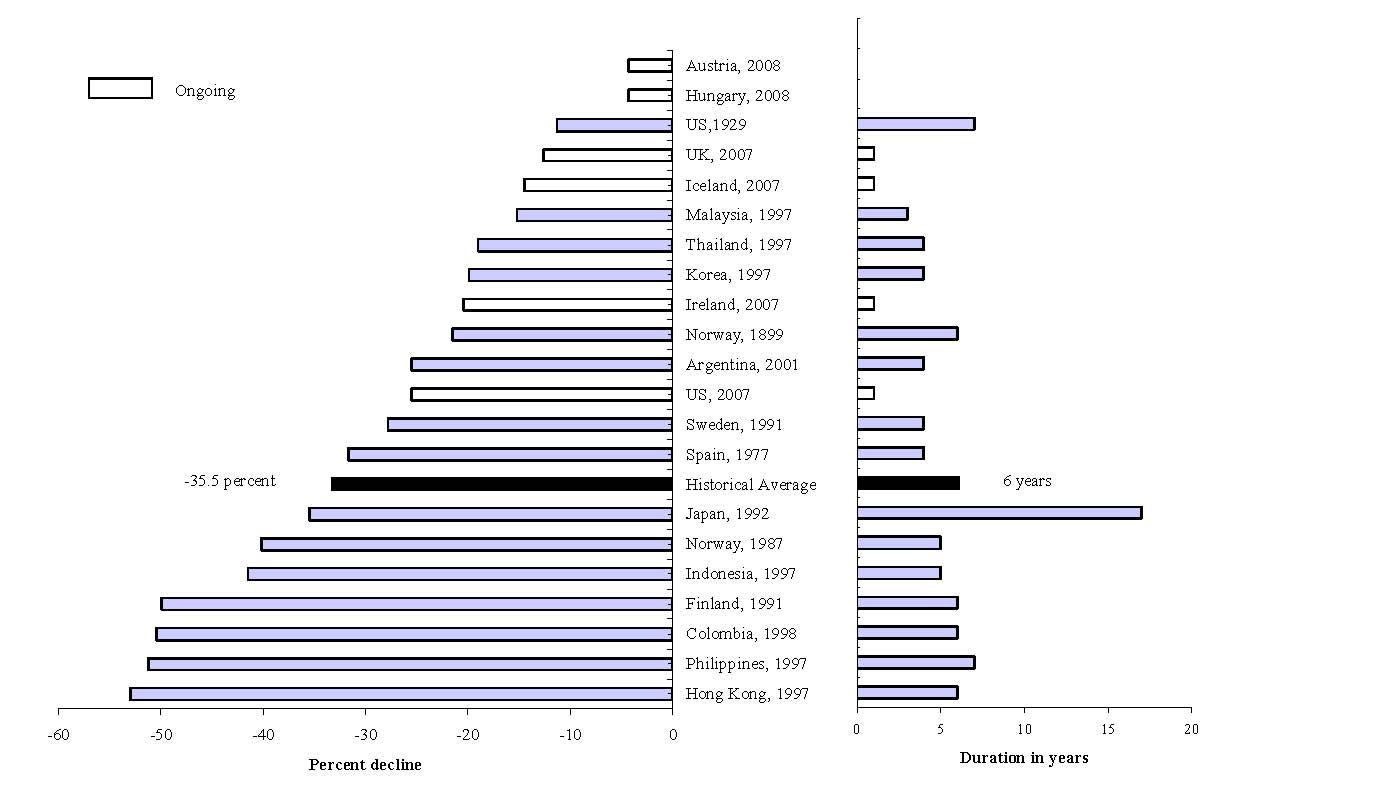
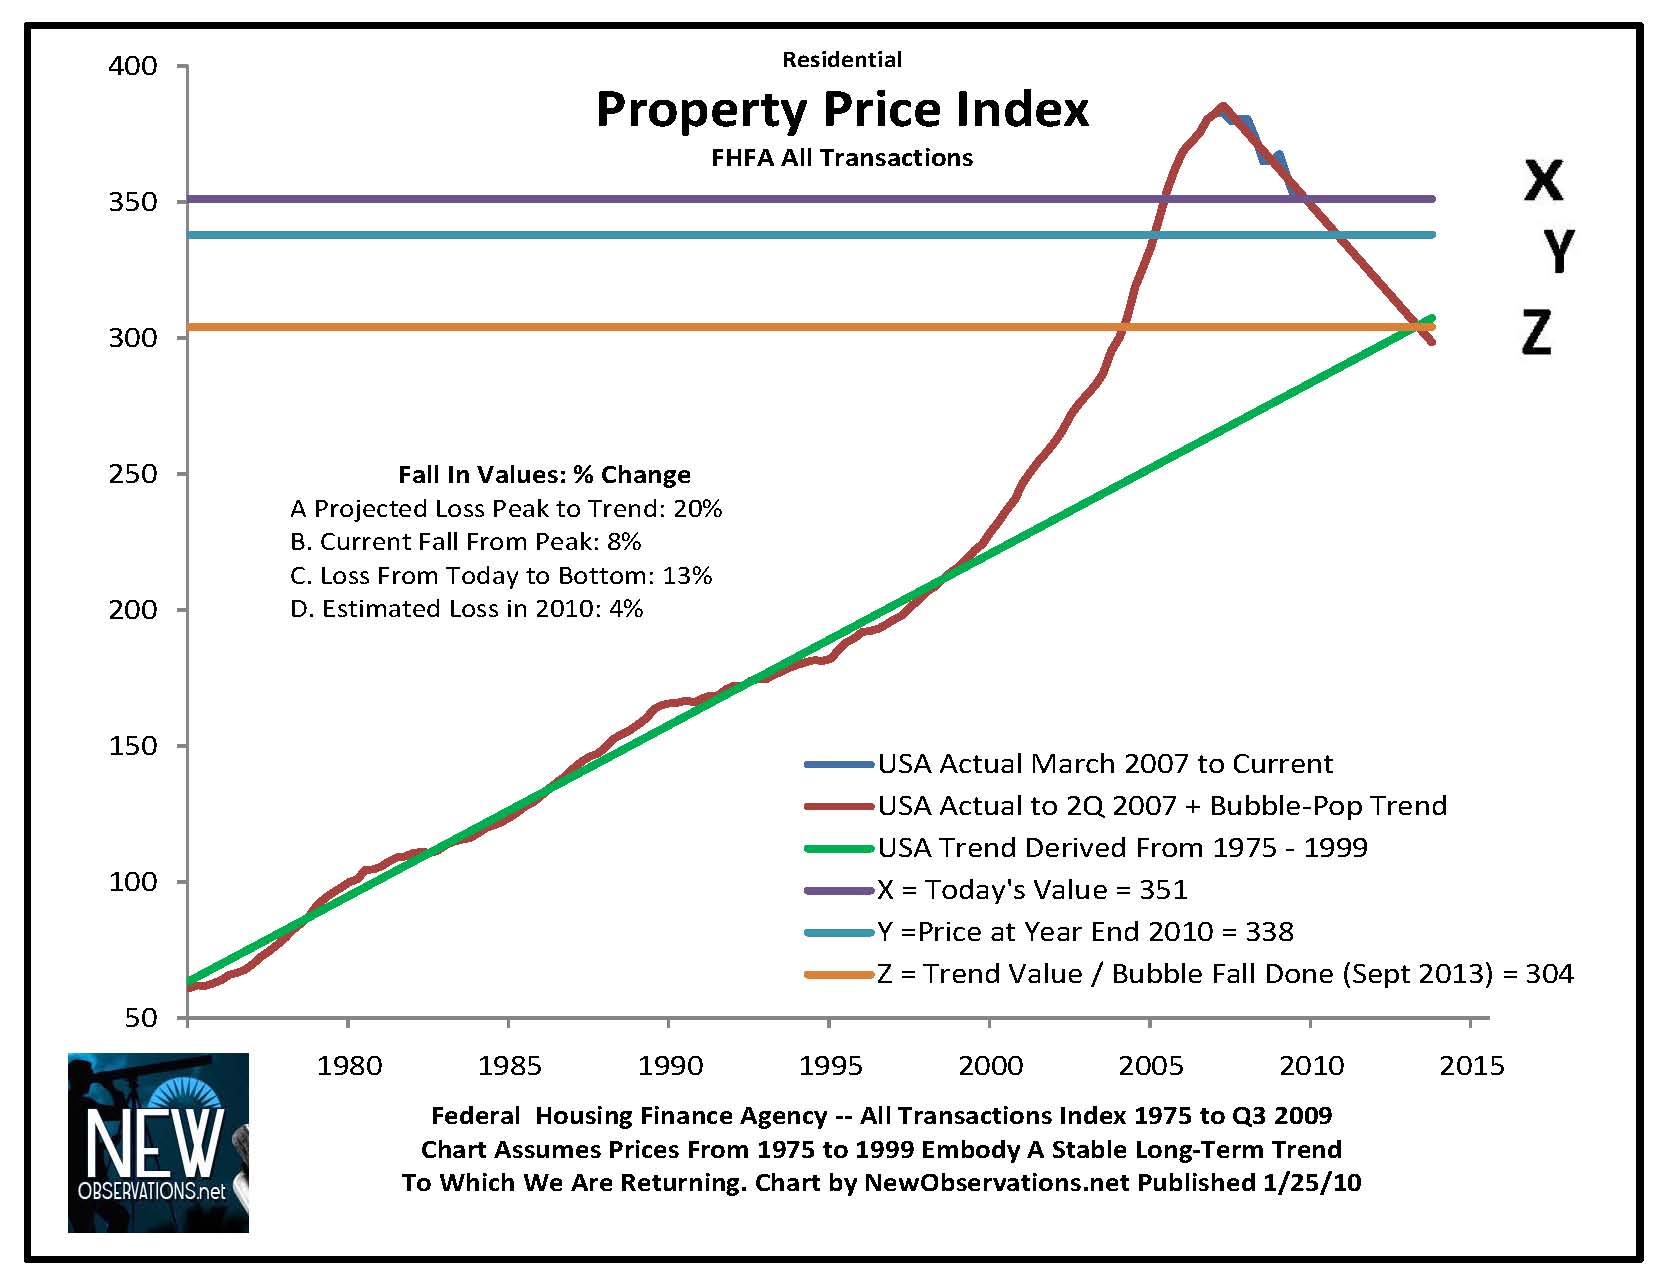
Two conservative data sets
see the fall in values continuing through the summer of 2013. If correct,
that’s equal to 3.5 more years of falling prices. The leading economic
historians say prices normally fall for six years after a credit bubble. Based
upon a summer 2006 high, the middle of 2012 is the projected bottom (Please see
the chart below from CARMEN M. REINHART and KENNETH S. ROGOFF.).
All of the forecasts here
are based upon the author’s assumption that real estate is a stable investment
which largely tracks inflation. The follow-on assumption is that values broke
out of this stable pricing pattern in a real estate bubble which started in
1990.
The basis of the primary
assumption, the assumption that real estate is a stable non-appreciating asset,
is taken directly from Robert Shiller. He is a leading expert on real estate
prices.
“My data show that between
1890 and 1990 real home prices actually didn’t increase,” Mr. Shiller wrote in
Newsweek (Dec 30, 2009), Why We’ll Always Have More Money Than Sense. If prices
didn't appreciate for 100 years, it leads one to assume the break in that
pattern is an artificial break.
The prediction of a 12%
fall this year averages forecasts ranging as high as 28% and as low as 4%. I
try to make no judgment about these estimates. I report the numbers objectively
based upon providing a linear projection of the fall in prices dating from the
market peak. Each data set is treated the same way. If the upward trend
starting in 1990 is supportable and real, then the numbers provided here are
very likely to be incorrect. If government policies reenact a bubble, these
numbers will also be incorrect.
The federal government has
taken extraordinary measures to stop the fall predicted by these trend charts.
Given the massive power of the United States Treasury and the Federal Reserve,
those efforts may win. Their steps to artificially maintain prices center on
Fannie Mae (FNM),
Freddie Mac (FRE),
and the FHA making essentially every new mortgage loan in the United States
today.
Without their lending, real
estate prices in the United States would fall dramatically. The author
estimates prices would fall 50% to 75% from today’s level if Fannie, Freddie,
and the FHA stopped making loans. Private investment in mortgage loans has
disappeared. Without government lending most purchases would have to be made
from the buyer's savings. Buyers would have to pay all cash. It's a way of
doing things we don't even understand.
We are in a radical real
estate depression hidden from us by massive government fixes.
***
The housing bubble was
created in a classic credit mania which artificially lifted the prices of all
assets which could be purchased with borrowed money. Credit manias are common
in human history. Normally time has to pass for the memory of the irrationality
to fade and to be allowed a new place to resume.
In our case we may have
simply re-fired the credit-mania stove immediately and we are now in and
marching toward new mania bubbles with new defaults and larger crises.
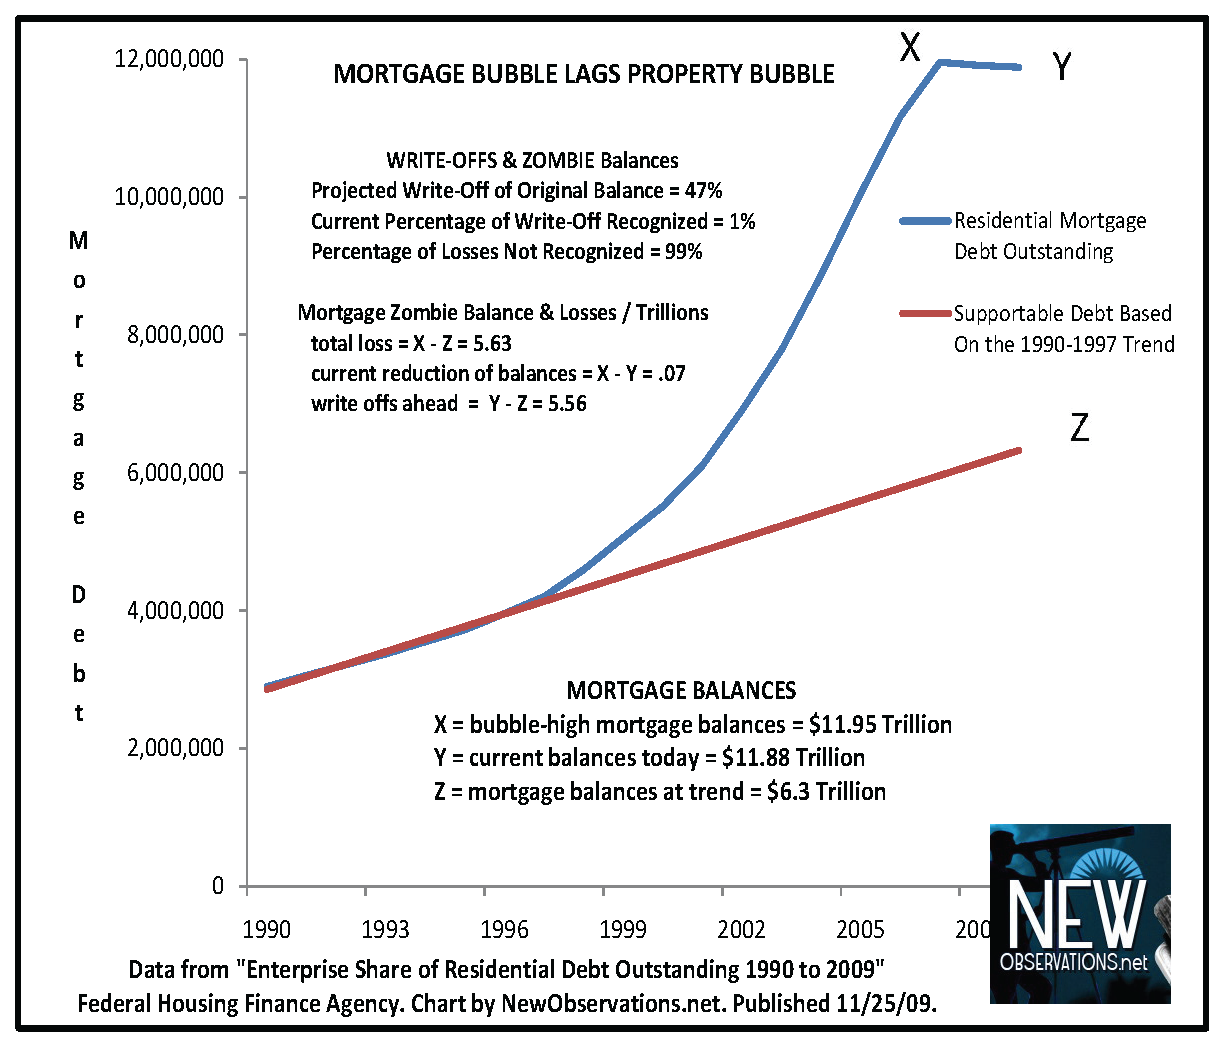
Residential real estate is
probably the most consequential of all the bubble assets from our current
crisis. Mortgages were the largest financial asset category of the last bubble
with a total issued at the top of about $12 trillion.
Real estate is of primary
importance to any family’s finances when they own the home that they live in.
Consumers have been hit with falling prices since as early as June 2006. The
numbers show current national losses of between 8% and 30%. This summer we will
reach the fourth year of a general trend of falling real estate prices. Against
that trend values have increased in the last two quarters.
All of the forecasts made
here include those recent increasing values in the projection of future losses.
The recent positive increases in value were not enough to counteract serious
and sometimes extreme losses in value over the last 3.5 years.
***
The government has made an
enormous assumption in crafting its policy on housing: It assumes that
maintaining values is of the utmost importance. It's a tragic mistake.
The proper way to manage a
credit bubble is to destroy errant debt issued beyond the capacity of the
borrower. This means that some subset of all mortgage debt issued after 1990 is
invalid. It’s a fiction and a fantasy. It is a dead-weight loss issued to fools
who believed in real estate as an investment.
In a November 2009 report I
estimated total excessive mortgage issuance of $5 trillion -- Losses and Zombie Debt in Residential Mortgages Surpass $5
trillion (See the chart above.).
***
Given that the most
essential element of our competitiveness is based upon the cost of labor, and
given that the price of housing is our most expensive cost of living, we cannot
live well, compete in the global marketplace, and pay for bubble-priced real
estate all at the same time. We have to make a very difficult decision.
The smartest conclusion is
obvious. Our highest priority must be to bring down the house of cards. We
should encourage foreclosures. We should encourage default. We should bring
overhead down. Our first goal must be inexpensive housing. (See Mortgage Default is a Patriotic Duty.)
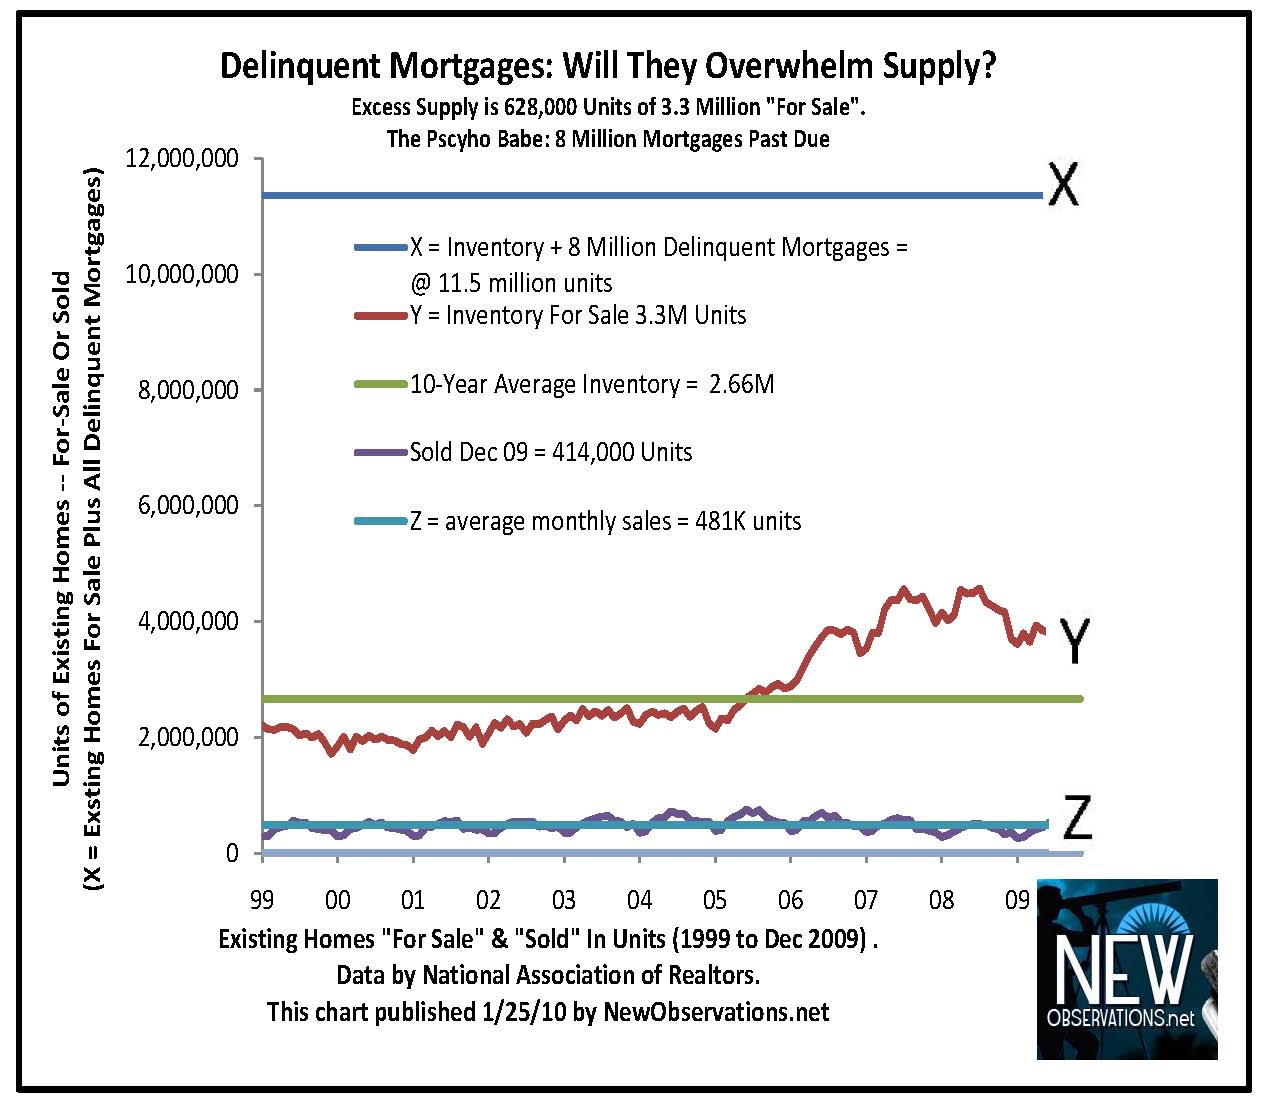
The most provocative of all
of the charts which I have been studying in the last six months suggests the
fall is inevitable. All of the government maneuvers will fail because
delinquent first mortgages are now equal in number to three times a balanced
for-sale inventory (Please see above “Delinquent Mortgages: Will They Overwhelm
Supply?”).
My prediction is that the
leaders at our Treasury and the Fed will finish as the bigger or the biggest
fools. They are waging nuclear war to maintain bubble pricing on 129 million
housing units (If you are like me, you say that sentence, and you know that the
policy is dead wrong.). Only an academic bureaucrat could make such a choice
and believe in it. And the financial press has not even one word to say against
this lunatic fantasy. The blind cover the dumb and vice versa.
Ben Bernanke and Timothy
Geithner prove that book learning makes you dumb and government work makes you
slow. Don’t put your faith in them or their experience. They haven't spent
enough time in the real world.
If you own real estate and
you can sell, sell it. If you want to buy, make sure you are staying for 10
years and insist on a great deal. Make sure you can live with losing 10 percent
or 20 percent or 30 percent of the price that you pay for your home.
The risk inherent in our
current real estate market is far beyond the tolerance of 98% of would-be
buyers. That means you. You can get screwed badly if you buy now. Don't do it.
Don't put yourself in the poor house.
***
Click here for more notes and data on the forecast.
Please send your suggestions and corrections. If you have a better way of
projecting the fall, please email me. I will send the Excel file for you to
re-work and then publish your findings.
Disclosure: none