Sliding Back Into the Great
Recession
Steven Hansen 1-24-10 [this is a rather mild if not optimistic
assessment inasmuch as it relies upon and inappropriately lends greater
credence to Leading Economic Indicators index which is skewed to the upside
owing to the overvalued bubble stock market component thereof and he himself
has some long positions which are contraindicated by reality – but charts and
data are always helpful as here provided]
This is the week of the
perfect storm. Investors do not like uncertainty, and prefer living with known
conditions – good or bad. This week the political landscape exploded with the
loss of the Democrats super-majority in the Senate throwing the health care
legislation (and current health care investment bets) into limbo.
In an obvious political
move to regain momentum, our President went on a populist rampage against the
financial industry which sent the markets in a downward spiral.
Concurrently from the
economic side, I was stunned by the very negative data from the Philly Fed who
released their survey of manufacturers for Jan 2010 (pdf):
Activity in the region’s manufacturing sector weakened this
month, according to firms surveyed for the January Business Outlook Survey.
The general activity and new orders indexes fell sharply this month, and
indexes for shipments and employment also turned negative. A significant share
of firms reported a rise in prices for inputs and for their own manufactured
goods. Also this month, the region’s manufacturing executives were less
optimistic about future activity, and most future indicators have fallen
considerably over the past three months.
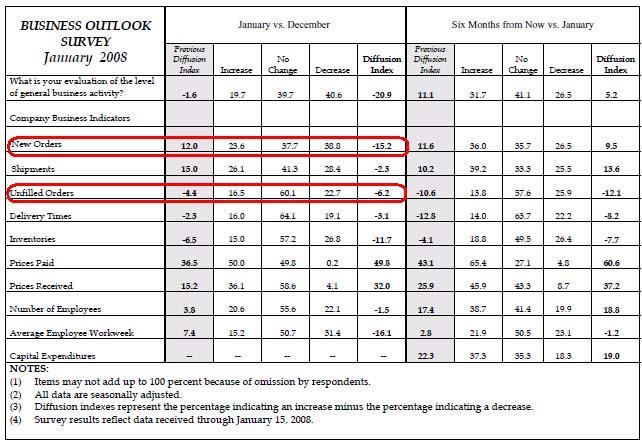
New orders and unfilled orders are negative MoM – extremely
negative. WTF?
This is a subjective survey a month ahead of real quantitative
data. This survey is diametrically opposite to the results of the NY Fed
manufacturing survey which I analyzed last week. If this survey is proven by
hard data, this will be the first indication we are sliding back into a
recession.
It also begs the question – did we ever leave the Great
Recession?
“The recession is over (if you happen to work at Goldman
Sachs).” [Hat tip to Mish]
Or why do the leading economic indicators continue to show
growth?
The leading indicators are likely correct. These indicators are
geared more towards forecasting GDP – and not Joe Sixpack’s world. Some
analysts expect a very strong 4Q2009 GDP. The first release of 4Q2009 GDP will
be at the end of this month.
Sometime in the past, GDP and Joe Sixpack’s world went
their separate ways. We began to lose the linkage between jobs and GDP in 1990.
To illustrate this point using chained 2005 dollars, we entered
2000 with a GDP of $11 trillion. Most likely, we will have left 2009 with a GDP
of $13 trillion. Over this 10 year period GDP expanded 18% in inflation
adjusted terms - yet over the same period we did not increase the size of the
workforce.
The only conclusion I can draw from this is that GDP
expansion must be higher than 1.5% to 2% to create jobs.
Yet, in 3Q2009, with a GDP increase of 2.2% - we still were
unable to increase the number of jobs in America. It may be that the disconnect
between jobs and GDP is growing, and we may well need over 3% GDP growth to
generate jobs.
My belief remains that GDP no longer is the primary tool for
measuring the American economy. GDP is a relic from the days of the industrial
revolution.
The people who date our recessions - NBER’s Business Cycle
Dating Committee – released the following statement supposedly on November 24, 2009 (hat
tip to The Big Picture who found this statement this
week):
The NBER’s Business Cycle Dating Committee maintains a
chronology of the U.S. business cycle. The chronology comprises alternating
dates of peaks and troughs in economic activity. A recession is a period
between a peak and a trough, and an expansion is a period between a trough and
a peak. During a recession, a significant decline in economic activity spreads
across the economy and can last from a few months to more than a year.
Similarly, during an expansion, economic activity rises substantially, spreads
across the economy, and usually lasts for several years.
In both recessions and expansions, brief reversals in economic
activity may occur—a recession may include a short period of expansion followed
by further decline; an expansion may include a short period of contraction
followed by further growth. The Committee applies its judgment based on the
above definitions of recessions and expansions and has no fixed rule to
determine whether a contraction is only a short interruption of an expansion,
or an expansion is only a short interruption of a contraction. The most recent
example of such a judgment that was less than obvious was in 1980-1982, when
the Committee determined that the contraction that began in 1981 was not a
continuation of the one that began in 1980, but rather a separate full
recession.
The Committee does not have a fixed definition of economic
activity. It examines and compares the behavior of various measures of broad
activity: real GDP measured on the product and income sides, economy-wide
employment, and real income. The Committee also may consider indicators that do
not cover the entire economy, such as real sales and the Federal Reserve’s
index of industrial production (IP).
The Committee’s use of these indicators in conjunction with the broad measures
recognizes the issue of double-counting of sectors included in both those
indicators and the broad measures. Still, a well-defined peak or trough in real
sales or IP might help to determine the overall peak or trough dates, particularly
if the economy-wide indicators are in conflict or do not have well-defined
peaks or troughs.
This was under the radar as it appears neither I nor others
received notification – and was not picked up by any media source. Now compare
the above NBER statement supposedly released on November 24th to the official
NBER Recession Dating Procedure which says in part:
In choosing the dates of business-cycle turning points, the
committee follows standard procedures to assure continuity in the chronology.
Because a recession influences the economy broadly and is not confined to one
sector, the committee emphasizes economy-wide measures of economic activity. The
committee views real GDP as the single best measure of aggregate economic
activity. In determining whether a recession has occurred and in identifying
the approximate dates of the peak and the trough, the committee therefore
places considerable weight on the estimates of real GDP issued by the Bureau of
Economic Analysis of the U.S. Department of Commerce. The traditional role of
the committee is to maintain a monthly chronology, however, and the BEA's real
GDP estimates are only available quarterly. For this reason, the committee refers
to a variety of monthly indicators to determine the months of peaks and
troughs.
It seems the NBER with their recent statement that GDP may not
be the primary measurement of the economy anymore. This is in direct conflict
with their procedures, but a welcome bit of fresh air.
It boils down to whether it is best to believe we are in a
recession, and keep the political emphasis on taking actions to make the
economy better – or simply ignore poor economic conditions telling the masses
the economy is improving.
Either way, I have no hope the President, Congress or the Fed
have any clue how to get this beast moving except through letting time cure the
economic ills or spouting populist agenda issues.
There continues to be no evidence the economy is expanding other
than the economic bounce you get when inventories deplete. The jobs situation
is worse than any four letter word I can use.
Now the Philly Fed survey has provided a whiff of further
contraction.
Hopefully, this survey is an anomaly.
Other Economic News this Week
Initial unemployment claims for the week ending January 16, 2010 increased slightly and is
hovering just below the level where historically payroll employment begins to
grow. I have heard many explanations for the increase this week, and this is
why I continue to monitor unemployment claims using a 4 week average.
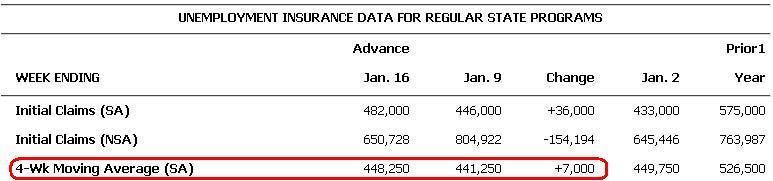
The initial claims picture, no matter how you spin it, is headed
downward at a painfully slow rate. The real question is whether America is
creating jobs as historical data might suggest.
The government’s statement on the December
2009 (pdf) Producer Price Index:
The Producer Price Index for Finished Goods moved up 0.2% in
December, seasonally adjusted. This rise followed a 1.8% advance in November
and a 0.3% increase in October. At the earlier stages of processing, prices
received by producers of intermediate goods rose 0.5% and the crude goods index
moved up 1.0 percent. On an unadjusted basis, prices for finished goods
advanced 4.4 percent in 2009, after falling 0.9% in 2008.
This month, if you exclude food and energy – what the economists
love to call core index items – the finished goods were unchanged MoM. However,
the intermediate goods and crude goods were up – but within the range of the
last 12 months.
Overall, there was nothing noteworthy in this release. I have,
however, included two graphs over the movement of the finished goods PPI since
2007 and 1970.
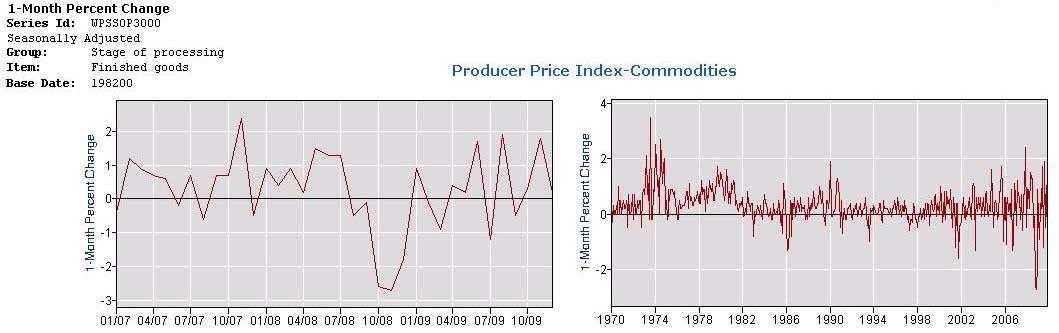
What is interesting is the ever increasing volatility of this
pricing index. It is beginning to look like a seismograph during a San Andreas
event. Are there any seismologist’s out there?
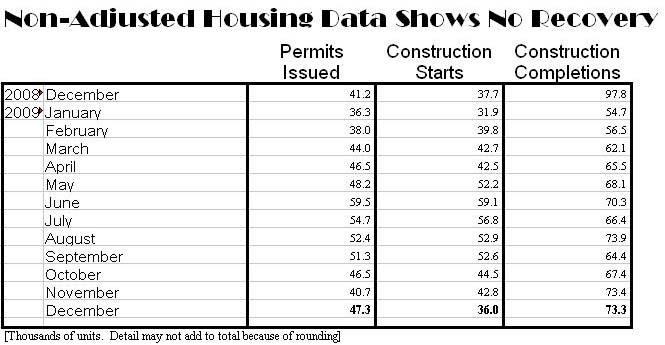
The government’s words on residential new construction data for December 2009:
Privately-owned housing units authorized by building permits in
December were at a seasonally adjusted annual rate of 653,000. This is 10.9%
above the revised November rate of 589,000 and is 15.8% above the December 2008
estimate of 564,000.
Privately-owned housing starts in December were at a seasonally
adjusted annual rate of 557,000. This is 4.0% below the revised November
estimate of 580,000, but is 0.2% above the December 2008 rate of 556,000.
Privately-owned housing completions in December were at a
seasonally adjusted annual rate of 768,000. This is 11.2% below the revised
November estimate of 865,000 and is 25.3% below the December 2008 rate of
1,028,000.
There is no evidence that any recovery is underway in this
sector using unadjusted data. Permits are up MoM and YoY (but remains range
bound), Starts and completions are down MoM and YoY. Historically, new home
starts pick up during recoveries. This recovery is different as we have a
surplus of houses. Therefore our “recovery” without residential construction
spending will be weaker than past recoveries.
The weekly Mortgage Bankers Association new mortgage application
data for the week ending 15 Jan 2010 improved slightly but remains
about half of the level of earlier this year using seasonally adjusted data.
The 30 year fixed mortgage rate dropped 13 basis points to 5.00%.
Bankruptcies this week: Morris Publishing Group, Atrium
Companies

Economic Forecasts Published this Past Week
 The
Economic Cycle
Research Institute (ECRI) released their Weekly Leading Index which
its yearly growth rate slipped slightly – but the WLI is still setting new
highs. Lakshman Achuthan, Managing Director at ECRI added:
The
Economic Cycle
Research Institute (ECRI) released their Weekly Leading Index which
its yearly growth rate slipped slightly – but the WLI is still setting new
highs. Lakshman Achuthan, Managing Director at ECRI added:
The index's annualized growth rate slipped again to a 19-week
low of 23.4% from 23.7% the previous week, which was revised up from an
original 23.5%. It marked the lowest yearly growth reading since the gauge
reached a record high in October. Still, with WLI levels continuing to rise,
the recovery will continue to gain ground in the months ahead. The yearly
growth rate figure sometimes moves inversely to the index level because the
latter is derived from a four-week moving average
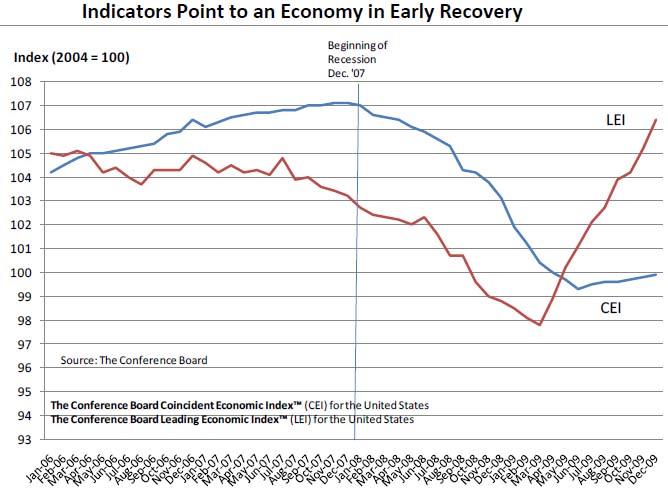
The Conference Board issued their Leading and Coincident
Economic Indexes for December 2009 (pdf). Statements from their
official news release:
The Conference Board LEI for the U.S. increased sharply in
December, and has risen steadily for nine consecutive months. The six-month
growth rate has picked up slightly to 5.2 percent (about a 10.8 percent annual
rate) in the period through December, substantially higher than earlier in the
year. In addition, the strengths among the leading indicators have remained
very widespread in recent months.
The indicators point to an economy in early recovery. The
coincident economic index shows slow expansion of economic activity through
December. The leading economic index suggests that the pace of improvement
could pick up this spring.
The Conference Board Coincident Economic Index™ (CEI)
for the U.S. rose 0.1 percent in December, following a 0.1% increase in both
November and October. The Conference Board Lagging Economic Index™ (LAG)
declined 0.2% in December, following a 0.5% decline in November, and a 0.2%
decline in October.
Disclosure: Author holds positions in GLD,
XPH,
XLB,
XLV,
FTR,
IOO,
HYG,
KSWS,
PIN,
WMT,
GDX,
Physical Gold - as well as numerous puts and calls which comprise less than 3%
of my portfolio