Dow
Closes Above 11,000; This Rally Has Ignored Fundamentals, and Will Be Corrected
Painfully, Hussman Says … The
market rebound we've experienced is near an end, and we should have seen it
coming, according to John Hussman of Hussman Funds…
Here's a breakdown of why Hussman thinks that, even if you ignore questions
about the banking system, this market is clearly in line for a correction.
- Investors have gone through two massive loss
periods in the past 12 years, and only gained 2.4% if they tracked the
S&P.
- Returns are going to be low over the next
several years, and while there might have been a price low in March 2009,
the valuation low has yet to be found. It may take another 6-8 years.
- This low return on the S&P is not the result
of other potential crises looming in the system, including credit
problems, but simple fundamentals.
- People are now buying into the market, relying
on economic growth and the absence of another credit crisis, rather than
on fundamentals.
As such, says Hussman:
This outcome is not dependent on
whether or not we observe a second set of credit strains, but is instead baked
into the cake as a predictable result of prevailing valuations. The risk of
further credit strains simply adds an additional layer of concern here.
Investors have chased risky securities over the past year to the point where
the risk premium for default risk has eroded to the levels we saw at the peak
of the credit bubble in 2007. MY SENSE IS THAT THIS IS A MISTAKE THAT
WILL BE PAINFULLY CORRECTED. Investors now rely on a sustained economic recovery and
the absence of any additional credit strains - and even then would be likely to
achieve only tepid long-term returns from these levels…
[$$] Losing Big -- Winning Anyway Does moral hazard even exist
anymore? The list goes on -- auto companies, banks, insurance companies and now
countries.
HAL 9000s Keep Dow at 11,000: Dave's Daily Dave's Daily
By Dave Fry, founder and publisher of ETF Digest and author of the best-selling book Create Your Own ETF Hedge Fund. HAL 9000s KEEP DJIA AT
11K There's no need to make this stuff up anymore since end-of-day
stick saves are right there and in your face. No pretense or deception is
necessary anymore. When you have "other people's money," including
the taxpayers to work with; you can do what you wish and not be called-out on
it. Who's going to do that anyway, the financial media?
LOL!!! Anyway, the media got the headline number they wanted and Main Street is
no doubt impressed. Now to the hard part--earnings. Starting with Alcoa
(which just reported a miss) will be followed by important companies like Intel
and Bank of America. There
isn't much in the way of economic news until Retail Sales and the Fed Beige
Book on Wednesday. Monday's volume was pathetically light; so managing the
market higher was easy for those who could … Per Investopedia: The
McClellan Summation Index is a long-term version of the McClellan Oscillator.
It is a market breadth indicator, and interpretation is similar to that of the
McClellan Oscillator, except that it is more suited to major trends. I
believe readings of +1000/-1000 reveal markets as much extended (charts show
+1250) …
Exciting Week for Stocks, ETFs but Economic Indicators (of which
the boot-strap bubble stock market is a significant component inflating /
obfuscating same) Tell Different Story … This week I read some truly remarkable and conflicting facts
that make things all the more interesting and confusing. On the up side, the
March Institute of Supply Management report was positive, as was the February
Pending Home Sales and Wholesale Sales, while Consumer Credit unexpectedly
contracted by a whopping -$11.5 Billion. Also this week, it barely made the
news that weekly unemployment claims unexpectedly rose by 18,000, and the four
week moving average was up from the previous week as well. Underemployment remains near 20%. We have
approximately 5 million non current home mortgages in the US and a record 40
million people on food stamps, a number which has steadily been rising over the
last year. In the housing sector, mortgages reached an eight month high this
week and even Chairman Bernanke said in a speech that we’re “far from being out
of the woods,” which is a chilling comment from one of the chief cheerleaders
and architects of the recovery. Looking at the all important housing and
employment markets, the FOMC meeting minutes released this week were even more
chilling.
Regarding
general conditions, the FOMC said:
Household spending going forward was
likely to remain constrained by weak labor market conditions, lower housing
wealth, tight credit, and modest income growth.
The employment outlook was not
particularly bright, in their opinion, as the minutes said:
Participants were concerned about the
scarcity of job openings, the elevated level of unemployment, and the extent of
longer-term unemployment .... Moreover the downward trend in initial
unemployment claims appeared to have leveled off in recent weeks ...
Regarding the all important housing
market, the minutes said:
Participants were also concerned that
activity in the housing sector appeared to be leveling off in most regions
despite various forms of government support, and they noted that commercial and
industrial real estate markets continued to weaken. Indeed, housing sales and
starts had flattened out at depressed levels, suggesting that previous improvements
in these indicators may have largely reflected transitory effects from the
first-time homebuyer tax credit rather than a fundamental strengthening of
housing activity.
It’s just hard to see any good news in
this report but somehow the markets have managed to ignore what clearly are
scary facts. Looking abroad, the Greek Tragedy continued to unfold with Greece
bonds crashing last week and requiring a 442 basis point premium to German
bonds to be sold which Prime Minister George Papandreou labeled as unsustainable.
Clearly Greece needs help from the European Union and probably the IMF and a
plan could be announced as early as this weekend to stave off Greece’s default.
Greece needs more than eleven billion eurodollars to cover debt between now and
the end of May and last week, ratings agency Fitch cut both the nation’s and
its banks’ credit ratings with a negative outlook. The problem here, of course,
is that it isn’t just Greece that is in trouble but the other so called “PIGS”
or Club Med states. Global contagion and sovereign defaults remain a real
concern in the months ahead. Looking to Asia, China had a failed bond auction
last week which went largely unnoticed in the US financial press. They offered
91 day and 273 day paper and neither offering was fully subscribed as they
tighten their money supply in an attempt to slow potential inflation. Finally,
earnings season starts Monday with Alcoa (AA), and late last week the company was hit with
analyst downgrades, perhaps to make their results “exceed expectations” in
spite of deteriorating earnings. What It All Means Adding it all up, we see an
overbought, complacent market on a technical basis and a relatively high risk
environment on a fundamental basis both at home and abroad …
Listen here and listen well: The frauds on wall
street know all the tricks, mechanized trading trendline buy signals, chart buy
signals, confirmation of trendlines, technical analysis, and other very
mechanically applied strategies, etc., and can, and do manipulate by
computerized buy programs (previously described in part on this website)
accordingly. Everything purporting to account for the rise has already been
discounted many times over to the upside over the past year and even that which
purports to be must be discounted along with the looming reality of
insurmountable debt crisis / debacle in this country, the GDP of which has
already begun to suffer from debt service / costs. Sell while you can / take
profits, gains / sell into strength / preserve principal / don’t be
caught holding their bag as in prior crashes.
This
is a secular bear market. This is a bull (s***) cycle in a secular bear market.
This is a manipulated bubble as has preceded the prior crashes with great
regularity that the wall street frauds and insiders commission and sell into.
Calm Before Another Global Market
Storm Cooper ’…And given
just how far this market appears to be manipulated it will have to be the bank
trading desks who decide to put on their short positions and catch the rest of
the market snoozing. Market timing How long will that take? If
only we knew. But being positioned away from a crash is more sensible than
being in the middle of it, unless you go short too. Realistically this should
not take too much longer. We know from past crashes like the one seen in 2008-9
that a rally is followed by a sharp correction, and the longer the rally the
sharper should be the correction. When the bank trading desks have killed every
short then they will go short and kill the bulls. It will not be a pretty
sight.’
Why Stocks are Extremely Overbought … On
borrowed time No doubt, extremes can go on for a while.
Nevertheless, it is interesting to note the common denominator between all
extremes - the year they last occurred are 1987, 2000, and 2007. All those
years had one thing in common - major declines.…To a larger degree than in the
past and at all cost, the government is doing all it can to prop up the economy
(see related article 'What or Who is Driving Up Prices').
And even though this might be working right now, we know that the government's
actions usually accomplish the opposite of what they intend…Take the
Glass-Steagall Act as an example. It was a law designed to control speculation.
This law was established in 1933, the year the Great Depression ended and was
repealed in 1999, just before the tech bubble burst…Two extremes we haven't
mentioned yet are P/E ratios and divided yields. Market bottoms are signaled by
low P/E ratios and high dividend yields. Just a few months ago, Standard &
Poor's pegged the P/E ratio based on reported earnings at 143, more than 10
times its historic average. Dividend yields have fallen close to the 1999
all-time low. This is not what a new bull market is made of…
Stocks:
A Rally That Defies Gravity (at BusinessWeek) … All
good things must come to an end, though, so investing pros naturally wonder how
long the market can keep up its winning streak. The market hit its 18-month
high in the face of widespread skepticism among both investors and the American
public.…Most individual retail investors have not been participating in the
rally. According to Morningstar (MORN),
investors pulled $3.7 billion out of U.S. stock funds in February, the fifth
month of outflows in the last six months. A Mar. 25 survey by the American
Association of Individual Investors showed 34.7% of respondents are bearish,
which is more than the 32.4% who are bullish and up from a 23% bearish reading
at the end of 2009. Many Americans seem unaware of the stock market's success
and gloomy about the economy, according to a Bloomberg
National Poll released Mar. 24. The broad S&P 500 rose 72.4% from Mar.
9, 2009, to Mar. 26, 2010. Yet the Bloomberg poll found only 31% of American
investors said the value of their investments had improved in the past year. By
contrast, 22% believe their investments' value has held steady and 46% believe
their value has fallen…
Dow 11,000 - How Much Upside is Left? - …Wall Street is always recommending
to buy and advocating higher prices, so it behooves us to dig a little deeper…According to Professor Shiller, the S&P (NYSEArca: SPY
- News)
is 30% overvalued. According to ETFguide's research, the extent of
overvaluation is even worse. Regardless of which analysis you chose, stocks
will eventually turn into a hot potato. Will you get burned?…
Fed Inflates Stock Bubble: Dave's Daily …The Fed minutes revealed the stunning conclusion interest rates will
stay low for an extended period if the economic outlook worsens or inflation
drops. Wow, that's surprising logic! With those mighty words stocks picked up
steam some and closed higher overall. Not mentioned by many mainstream media
talking heads is the building stock market bubble which, of course, few would
care to see or discuss. It's what the Fed does--
Fed Governor Dares Say 'Bubble': Dave's Daily HOENIG SEES A BUBBLE & STOCKS SEE RED …Hoenig stated: "In particular, what are the hazards of
holding the Federal Funds rate target close to zero? The risks of raising too
soon are clear and compelling. My comments, however, concern the risks of
raising rates too late. Such risks also can be significant but all too often
seem more distant and less compelling, and therefore hold great long-term
danger for us all...I have dissented at the last two FOMC meetings specifically
because I believe the 'extended period' language is no longer warranted and I
am concerned about the buildup of financial imbalances creating long-run
risks....And, the market appears to interpret the extended period as at least
six months. Such actions, moreover, have the effect of encouraging investors to
place bets that rely on the continuance of exceptionally easy monetary
policy. I have no doubt that many on Wall Street are looking at this as a
rare opportunity." At least he's articulating what many are
thinking--an asset bubble is brewing and it's being fed by current easy money policies. Lacking
other news and with volume light before his remarks, investors took his words
to heart Wednesday and started selling…
THE FED'S SHELL GAME
CONTINUES... Chris Martenson - Executive Summary
- Record-breaking Treasury auctions continue to go
off without a hitch, thanks to massive foreign participation.
- However, the amounts reported to be bought in
the auction results do not match the Custody Account or TIC report
amounts.
- The Fed is allegedly all done buying MBS and
Treasury paper. This cuts off an important source of liquidity for the
Treasury, commodity, and stock markets.
- How will these markets respond to a liquidity
drought?
April is upon us. I need to take a
moment to re-analyze the data to see what might happen now that the stimulus
money has worn off, and, more importantly, now that the Federal Reserve's
massive Mortgage Backed Security [MBS] purchase program is over. This is
important for a variety of reasons.
·
The
first is that the enormous flood of liquidity that the Federal Reserve injected
into the financial system has found its way into the Treasury market,
supporting government borrowing and also lowering interest rates for the
housing market. How will the Treasury market respond once the liquidity spigot
is turned off?
·
The
second is that this flood of liquidity has supported all sorts of other asset
markets along the way, including the stock and commodity markets.
·
What
will happen to these when the flood stops? Will the base economy have recovered
enough that the financial markets can operate on their own? Will stocks falter
after an amazing run? Or will the whole thing shudder to a halt for a
double-dip recession?
Back in August of 2009, I wrote that the
Federal Reserve was basically just directly monetizing U.S. government debt by
buying recent Treasury issuances as well as Mortgage Backed Securities [MBS].
Here's the conclusion from that report:
·
The
Federal Reserve has effectively been monetizing far more US government debt
than has openly been revealed, by cleverly enabling foreign central banks to
swap their agency debt for Treasury debt. This is not a sign of strength and
reveals a pattern of trading temporary relief for future difficulties.
·
This is
very nearly the same path that Zimbabwe took, resulting in the complete
abandonment of the Zimbabwe dollar as a unit of currency. The difference is in
the complexity of the game being played, not the substance of the actions
themselves.
·
When
the full scope of this program is more widely recognized, ever more pressure
will fall upon the dollar, as more and more private investors shun the dollar
and all dollar-denominated instruments as stores of value and wealth. This will
further burden the efforts of the various central banks around the world, as
they endeavor to meet the vast borrowing desires of the US government.
My surprise at all of this has been
twofold. The shell game has continued this long without the bond market calling
the bluff, and I am baffled by the extent to which the other world central
banks have both enabled and participated in this game. Part of the explanation
behind this unwavering support for the dollar and U.S. deficit spending by
other central banks lies in the fact that other Western and Eastern governments
are equally insolvent…
Seeking Alpha/Tradermark/Ritholtz “… Yes, there is an
insanity to the markets that can make you mad if you let it. Instead, learn to
see the delightful absurdity of it all. Revel in the stupidity, learn to read when the "wisdom of the
crowd" turns into an angry mob. Find some Zen in the foolishness of
others. Step back and look for the variant perception ... Consider this was an
issue from 1996 or '97 until the collapse in 2000, and from 2005 to the
collapse in 2008-09 …”
All Just a Big Bubble … this
is the end of the road. That is, if the last forty years were all just one big
money and credit bubble, temporarily misinterpreted as prosperity, that can
produce no more bubbles except for the one that is most feared - another
massive bubble in natural resources as a relatively fixed supply of goods meets
up with an unlimited supply of paper money. It's no coincidence that the almost
non-stop sequence of financial bubbles over the last forty years followed the
abandonment of anything resembling a system of sound money. Contemporary
economic thought posits that money is simply a "unit of account" and
that there is no longer any need for it to maintain an intrinsic value of any
sort. They say it's just "notations on paper" and that the world's
economic and financial wizards, though set back a bit by their latest failure,
have things squarely under control. If you're anything like me, you don't
believe that for a second. In the fullness of time, the last forty years will
likely be seen as an aberration - just one big bubble - as theories are
abandoned and a more enlightened approach ultimately prevails. Unfortunately,
between now and then, things are likely to get worse before they get better.
Here’s
Why The Money Supply Has Exploded, But We Haven’t Seen Rampant Inflation Yet
One of the things
they are doing with it is buying U.S. government debt… So instead of loaning money
to American businesses and consumers who desperately need it, a
ton of this new money is being used to pump up yet another
bubble. This time the bubble is in U.S. Treasuries. Asia Times recently described how this
trillion-dollar carry trade in U.S. government securities works… Remarkably,
the most aggressive buyers of US government debt during the past several months
have been global banks domiciled in London and the Cayman Islands. They borrow
at 20 basis points (a fifth of a percentage point) and buy Treasury securities
paying 1% to 3%, depending on maturity. This is the famous “carry trade”, by
which banks or hedge funds borrow short-term at a very low rate and lend
medium- or long-term at a higher rate. This works as long as short-tem rates
remain extremely low. The moment that borrowing costs begin to rise, the
trillion-dollar carry trade in US government securities will collapse. So
what happens when this bubble collapses? Nobody knows for sure. But
anyone who has dealt with carry trades in the past knows that when carry trades
unwind they can do so very, very quickly and the results can be nightmarish.
The truth is that the U.S. financial system is a house of cards that could fall
at any time. A lot of economic pain is on the horizon – it is only a
matter of when it comes and how bad it is going to get. Trends forecaster
Gerald Celente is predicting that it could be as soon as this year…
Indicators Most Overbought Since 2000 and 2007! 2007-Like
Decline Next … A DECADE OF EXTREMES The years 1999/2000 were a time of
extremes. In the last 15 months of its rally phase, the Nasdaq (Nasdaq: QQQQ
- News)
exploded and jumped up 50%. This rally was based on expected earnings of brand new
internet and tech (NYSEArca: XLK - News)
companies with no track record. As sharp as the rally was, the decline was even
more powerful. The years 2007/2008 were another period of extremes. Financial
companies (NYSEArca: XLF - News),
never known for their hard work, found a way to make money even easier -
trading and selling financial derivatives. In retrospect, it is quite amazing
that this financially engineered house of cards did not collapse earlier. But
with the real estate sector (NYSEArca: IYR
- News)
weakening significantly, it was just a matter of time before the sub-prime
avalanche would hit the fan and Wall Street. Looking back it becomes obvious
that the last ten years are composed of a cycle of building and deflating
bubbles. The euphoria of rising markets was quickly distinguished by the pain
of bursting bubbles. One thing we should have learned by now is that euphoria
is the perfect breeding ground for problems. FOOL
ME ONCE, ...As humans we are equipped with longer-term memories than rabbits
and are generally reluctant to get burned twice. This decade has seen many get
burned three times. Once with technology, once with real estate and once more
with stocks in general (NYSEArca: TMW - News).
There seems to have been just enough time between 2000 and 2007 to forget the
tech-bubble and real estate, well real estate is a different asset class and
was supposed to go up at all times - but it didn't. TURN
ON THE GPS
It is easy to forget where we are today. Let's turn on the GPS to get a read on
our exact location. Over the past year, the Dow Jones (DJI: ^DJI), S&P 500
(SNP: ^GSPC), Nasdaq (Nasdaq: ^IXIC), small caps (NYSEArca: IWM
- News),
mid-caps (NYSEArca: MDY - News),
large caps (NYSEArca: IVV - News)
and virtually all other asset classes have gained 70% or more. This in itself
is an extreme that has never happened before. For nearly six weeks, investors
haven't seen a broad index lose more than 1%. Until yesterday, there hasn't
been more than four hours of selling pressure since the February 8 lows. THOSE EXTREMES ARE AMAZING BY THEMSELVES.
BUT WAIT, THERE IS MORE. Last
week the National Association of Active Investment Managers (NAAIM) reported
that 95% of active mutual fund managers are net long. This is the highest
reading since October 17, 2007. Investors are feeling the same way. In
December, portfolio cash allocation dropped to the lowest level since April
2000, while stock allocation rose to the highest level since September 2007
(according to AAII). Earlier this week, the Volatility Index - VIX (Chicago
Options: ^VIX) dropped to its lowest level since July 2007. On December 31,
2009, the percentage of bearish investment advisors dropped to the lowest level
since April 1987, while the percentage of bullish advisors spiked to the
highest level since December 2007 (according to II) … ON BORROWED
TIME No doubt, extremes can go on for a
while. Nevertheless, it is interesting to note the common denominator between
all extremes - the year they last occurred are 1987, 2000, and 2007. All those
years had one thing in common - major declines. Is this time different? To a
larger degree than in the past and at all cost, the government is doing all it
can to prop up the economy (see related article 'What or Who is Driving Up Prices').
And even though this might be working right now, we know that the government's
actions usually accomplish the opposite of what they intend. Take the
Glass-Steagall Act as an example. It was a law designed to control speculation.
This law was established in 1933, the year the Great Depression ended and was
repealed in 1999, just before the tech bubble burst. The current rally is as
unprecedented as it has been unexpected. A little more than a year ago, Wall Street
was bracing itself for a repeat of the Great Depression. It was at exactly that
time, on March 2, 2009, that the ETF Profit Strategy Newsletter sent out a
Trend Change Alert, recommending to sell short ETFs and buy long and leveraged
long ETFs like the Ultra S&P 500 ProShares (NYSEArca: SSO
- News)
and Ultra Financial ProShares (NYSEArca: UYG
- News).
The target for the end of this rally was Dow 9,000 - 10,000, which should be
marked by extreme levels of optimism and a 'the worst is over attitude.' The
market has certainly delivered on this outlook. You may find it interesting
that the percentage of stock market bulls reached a record-low at that time.
Once again, when it was time to buy, investors at large turned to cash. VALUATION
EXTREMES When it comes right down to it, valuations
are the only thing that really matters. After all, who wants to overpay?
Perception often drives valuations for a period of time. You may remember when
VW re-launched the Beetle or BMW unveiled the brand-new Mini Cooper. Initially
dealers were able to charge up to $5,000 on top of the MSRP simply because
buyers would pay it. Today you can pick them up on the cheap simply because
consumers won't pay a premium. What's changed? Perception. The same holds true
for the Toyota Prius, which was a hot commodity during the $5/gallon gas price
era and is plagued by recall troubles today.Just like cars or hot
Christmas toys, stocks are largely driven by perception and valuation. History,
however, shows unequivocally that profit margins, P/E ratios, and dividend
yields always trump the perception of prices and pass through fair value
eventually. Two extremes we haven't mentioned yet are P/E ratios and divided
yields. Market bottoms are signaled by low P/E ratios and high dividend yields.
Just a few months ago, Standard & Poor's pegged the P/E ratio based on
reported earnings at 143, more than 10 times its historic average. Dividend
yields have fallen close to the 1999 all-time low. This is not what a new bull
market is made of. Even though momentum still keeps prices going up, now is the
time to prepare for when they won't be. Every investor needs to know where fair
valuations are to determine the downside risk…
20 Signs That Could Mark a Top After what appears to be the call of the decade (although he
was a few weeks early) with his S&P 666 is a "generational low,"
Doug Kass remained bullish for a good long time. But late last fall he began pulling in his reigns … Now, nearly 13 months later and with
the S&P 500 almost 500 points higher, it is time to focus on a new
checklist of some potential adverse developments that could contribute to a
market top and a reversal of investors' good fortunes since March 2009.
- Interest Rates: The yield on the 10-year U.S. note might climb
to over 4% (now at 3.85%). A 4.00% to 4.25% yield would likely provide a
tipping point for increased competition to equities and produce an
interest (mortgage) rate headwind to the nascent housing recovery at a
time when stock dividend yields have nearly halved and when a large
phantom inventory of unsold homes is about to begin to enter the
residential for-sale market.
- Jobs / Economy: A more sluggish-than-expected expansion in new
jobs and the weight of higher taxes in 2011 might translate to a downturn
in consumer confidence, reduced business fixed investment and a more
shallow domestic economic recovery in the second half of this year.
- Retail:
Cautious forward comp guidance in retail could reverse the February-March
strength.
- Europe:
There could be growing signs of weakness in the European economies.
- Credit:
Over there, we might witness evidence of more sovereign (Spain?) crises,
and, over here, we could see more U.S. municipal -- the universe is large!
-- financial woes. Forced austerity measures would likely produce lower growth.
- Credit (Part Deux): Credit spreads might widen.
- Geopolitical: We could see a possible rise in geopolitical tensions or even
another terrorist act on our shore.
- Monetary Policy: We might have a less dovish Fed in words
(jawboning) and in action (through an increase in the federal funds rate).
- Tightening Abroad: It is likely that central banks around the
world will begin to clench their monetary fist, especially in China.
- Protectionism, Trade and Currency Wars: Things might get ugly, especially on the U.S. /
China front.
- Housing: A renewed leg down in home prices is possible as the spring
selling season could fail to appear. (It hasn't gotten off to a great
start.)
- Sentiment: We could witness the birth of a 5x to 10x levered bullish ETF, a
burst in bullish investor sentiment, an expansion in hedge fund net long
positions, a further drawdown in mutual fund cash positions, a meaningful
increase in retail mutual fund equity inflows and massive outflows out of
Rydex bear funds.
- Technical: Stocks could fail to respond to good news, suggesting that the
sharp corporate profit recovery has been baked into prices. A breakdown in
financials and/or transports could occur. Overseas markets might fail to
make new highs, or we could see a further contraction in NYSE / Nasdaq
exchange volume.
- Deflation: Industrial commodity prices could weaken.
- Speculation: We might see an increasingly speculative market for low-price
issues.
- Underwritings: The emergence of a record syndicate calendar is possible.
- Wall Street: A substantial increase in Wall Street industry hirings could be
announced.
- Dr. Doom vs. the Sunshine Boys: Dr. Nouriel Roubini could see green shoots,
causing bullish strategists and money managers to demonstrate even more
swagger. Reminiscent of late 1998, a sell-side analyst (perhaps the new Henry
Blodgett) might raise his 12-month Apple (AAPL) price target to $375 a share, leading
another analyst to top that target and move to $400 a share a week later.
- The Media: CNBC could throw another celebratory party. Time
magazine might declare the death of the bear market on its cover or run a
cover story offering a new bullish economic and/or stock market paradigm.
Sir Larry Kudlow could have trouble finding a single bear to appear on CNBC's
"The Kudlow Report." Record ratings might induce the management
of CNBC to expand "Squawk Box" from three hours to four
hours (6:00 a.m. to 10:00 a.m.) and add an additional anchor to join Joe,
Becky and Carl.
11 Clear Signs That The U.S. Economy Is Headed Into The
Toilet
The Economic Collapse
January 15, 2010
The vast majority of the talking heads
on television are still speaking of the current economic collapse as if it is a
temporary “recession” that will soon be over. So far, the vast majority
of the American people seem to believe this as well, although for many
Americans there is a very deep gnawing in the pit of their stomachs that is telling
them that there is something very, very wrong this time around. The
truth is that the foundations of the U.S. economy have been destroyed by
an orgy of government, corporate and individual debt that has gone on for
decades. It was the greatest party in the history of the world, but now
the party is over. The following are 11 signs from just this past
month that show that the U.S. economy is headed into the toilet and
will not be recovering….
#1) When even Wal-Mart is closing
stores you know things are bad. Wal-Mart announced on Monday that it will close 10 money-losing Sam’s Club stores
and will cut 1,500 jobs in order to reduce costs. So if even
Wal-Mart has to shut down stores, what chance do other retailers have?
#2) Americans are going broke at a
staggering pace. 1.41 million Americans filed for personal bankruptcy in
2009 – a 32 percent increase over 2008.
#3) American workers are working harder
than ever and yet making less. After adjusting for inflation, pay for
production and non-supervisory workers (80 percent of the private
workforce) is 9% lower than it was in 1973. But
those Americans who do still have jobs are the fortunate ones.
#4) Unemployment is absolutely
exploding all over the United States. Minority groups have been hit
particularly hard. For example, unemployment on many U.S. Indian
reservations is over 80 percent.
#5) Unfortunately the employment
situation is showing no signs of turning around. December was actually the worst month for U.S. unemployment
since the so-called ”Great Recession” began.
#6) So just how bad are things when
compared to past recessions? During the 2001 recession, the U.S.
economy lost 2% of its jobs and it took four years to get them back. This
time the U.S. economy has lost more than 5% of its jobs and there is
no sign that the bleeding of jobs will stop any time soon.
#7) Can you imagine trying to get your
first job in this economic climate? Our young men and women either can’t
get work or have given up on work altogether. The percentage
of Americans 16 to 24 who have jobs is 13 percent lower than ten years ago.
#8) So where did all the jobs go?
Over the past few decades we have allowed the corporate giants to ship
mountains of American jobs overseas, and there are signs that this trend is
only going to get worse. In fact, Princeton University economist Alan S.
Blinder estimates that 22% to 29% of all current U.S. jobs will be offshorable within two decades.
So get ready for even more of our jobs to be shipped off to Mexico, China and
India.
#9) All of these job losses are leading
to defaults on mortgages. Over the past couple of years we have seen the
American Dream in reverse. According to a report that was just
released, delinquent home loans at government-controlled mortgage finance
giants Fannie Mae and Freddie Mac surged 20 percent from July through September.
#10) But that is nothing compared to
what is coming. A massive “second wave” of mortgage defaults is getting
ready to hit the U.S. economy starting in 2010. In fact, this “second
wave” is so frightening that even 60 Minutes is reporting on it.
#11) Meanwhile, the Federal Reserve has announced that it made a record profit of $46.1 billion in
2009. Apparently during this economic crisis it is
a very good time to be a bankster.
I
DON'T KNOW HOW MUCH CLEAR IT GETS THAN THIS:
By Scott Lanman and Craig Torres
Jan. 7 (Bloomberg) -- U.S. regulators including the Federal
Reserve warned banks to guard against possible losses from an
end to low interest rates and reduce exposure or raise capital
if needed.
“In the current environment of historically low
short-term
interest rates, it is important for institutions to have robust
processes for measuring and, where necessary, mitigating their
exposure to potential increases in interest rates,” the Federal
Financial Institutions Examination Council, which includes the
Fed, Federal Deposit Insurance Corp. and other agencies, said in
a statement today.
Let me point
out a few things.
- We have never seen a crash and
rebound in US stock market history like what we have just experienced,
except once. That "once" was 1929/1930. What followed
next was a grueling grind - not a crash, but a grind that never ended, and
in which the market lost more than 80% of it's value. Those who
argue "the bigger the dive the bigger the bounce" forget that
the only true comparison against what we have just seen was in fact the
prelude to a grinding 90%+ overall decline.
- If you believe in "long wave" cycles -
that is, Kondratieff cycles, we have precisely followed
the several-hundred-year long pattern though its latest incarnation, with
the 1982-2000ish period being "Autumn." Winter follows fall.
These cycles seem to happen mostly because all (or essentially all) of the
people who lived through the last cycle's horrors are dead. Unless we have
found a way to break a cycle that has endured far longer than our nation,
we're right where we should be - which incidentally aligns with what
happened in 1929/30 as well. This means that while there may be ups and
downs we have not bottomed - not by a long shot - no
matter what people tell you.
- Interest rates can only go up from zero. That
should be obvious. Rising rates are not positive for equities and multiple
expansion.
- The Financials are getting a tremendous
bid the last few days, presumably on the premise that "employment is
at least somewhat stabilizing." With zero short rates and a steep
yield curve, this means they make a lot of money. But rates cannot
stay where they are if in fact the economy is recovering, and if the long
end rises it will choke off housing.
- At the same time people are rotating into a
sector The Fed and regulators just said will be forced to constrain
its profits people are fleeing the stocks (tech)
that have been on a tear. This is exactly backward based
on the news flow. Are The Fed and Regulators lying or is the
"optimism" incredibly misplaced (and even stupid if they're
rotating out of winners for what were just announced would be losers!)
- P/Es are at record levels. Yes,
that's on "as reported" 12 month trailing, and it is down
materially since one of the two "disaster quarters" is now gone.
But even with the other gone (which it will be in another month) we
will be trading at somewhere around 40 or 50x earnings, an utterly
unsupportable level and above where we were in 1999 - just before the
entire market fell apart. Even on "operating earnings"
we're trading at 24 times - outrageously overvalued from a historical
perspective.
We
also have the BIS calling in bankers to warn them that they've changed nothing
in their behavior (gee, really?) and China
making a serious attempt to pop their property bubble (must be nice to
actually pay attention to such things, eh?)
For today,
"party on Garth" in equities.
Let me simply
remind people that what got me writing The Market Ticker was this
event - something that I missed the signs of because I was overly
complacent, just as people are being right now.
That was 2006
and into 2007, remember?
Straight up -
right up until it wasn't, and 60 SPX points came off in one day. That warning
(and mine when I started writing) was ignored by a whole lot of people too who
thought it was a "blip."
Uh, no, it was
a warning and those who failed to heed it got their heads handed to them.
Don't worry
folks, it can't happen again. Remember, The Fed has our back, just as they did
in 2006 when they told us there was nothing to worry about in the summer when
we got the swoon (remember that? I do - and bought into it!)
The picture
now is actually worse than it was in early 2007. In early 2007
we had solid employment, we still had a reasonable housing market although it
had slowed some, GDP was positive and we had just come off a GREAT
Christmas season with extraordinary profits and sales. In addition we were
running ~350 billion in deficits, not $1.6 trillion (estimated for FY10) nor
did we have to roll and issue over $2 trillion of treasury debt (to someone!)
in the next 12 months.
Now we have
the regulators issuing formal warnings about bank liquidity and
interest rate risk (no really, you think that might be an issue with
that sort of issue behavior?) while at the same time formal liquidity support
in the form of monetization along with stimulus spending is slipping away - the
source of the liquidity that fueled the rally from March.
Ignore all
this if you're brave - or stupid.
PIMCO isn't. Bill Gross sees the same thing I
see.
Shadowstats’ John Williams: Prepare For The
Hyperinflationary Great Depression
- S&P historical return: Using
Barsky-Delong model, to achieve an annual real return of 4.2%, the S&P
would need to be at 810. Or putting it the other way, Hussman stated that
"the conclusion is not that stocks must decline immediately, but
rather, that long-term total returns for the S&P 500 are likely to be
less than 4.2% after inflation." "Alternatively, on the
assumption that future growth rates match what we've observed over the
past two decades and indeed over most of the past century, an expected
long-term total return of 10% for the S&P 500 (what investors
generally carry in their heads as the 'typical'long-term return on stocks)
would currently be consistent with an index level of 672".
- 'Second wave' concerns begin to
appear: Hussman has been warning that the second wave of housing credit
crunching (the mortgage reset) is approaching the peak at this moment. He
quoted Meredith Whitney's interview on CNBC which was very negative on the
outlook of 2010: "which is so disturbing on so many levels to have so
many Americans be kicked out of the financial system, and the consequence
both political and economic of that is a real issue you can't get around.
It's never happened before in this country or in the modern economy. The
biggest trend in 2010 will be seeing who gets kicked out of the banking
system." …
Case-Shiller Still Predicts Massive 45% Fall from Today’s Values 11-27-09
The 10 major cities in the Standard & Poor’s/Case-Shiller home price index have
risen 5% from their April low, but the index is still predicting a massive 45%
fall from today’s values.
HERE IS WHY THE DOLLAR IS NOW EFFECTIVELY WORTHLESS Tyler
Durden Zero
HedgeTuesday, Nov 24th, 2009A picture is worth
a thousand Krugman essays, which is why we present a chart comparing the US
Monetary Base (and by subtracting Reserve Balances with Fed Reserve Banks,
Currency in Circulation), and the Fed’s holdings of MBS and Agency paper
(worthless GSE/FHA garbage). In summary: Currency in Circulation: $920 billion;
MBS/Agency Holdings: $997 billion. The dollar in your pocket is now
entirely backed only by worthless, rapidly devaluing and subsidized housing.
15 signs Wall Street pathology is
spreading By Paul B. Farrell,
MarketWatch ARROYO GRANDE, Calif. (MarketWatch) -- In "The Battle
for the Soul of Capitalism" Jack Bogle no longer sees Adam Smith's
"invisible hand" driving "capitalism in a healthy, positive
direction." …Wall Street plus co-conspirators in Washington and Corporate
America are spreading a contagious "pathological mutation of
capitalism" driven by the new "invisible hands" of this new
"mutant capitalism," serving their selfish agenda in a war to totally
control America's democracy and capitalism. The "Goldman Conspiracy" is the perfect B-school case
study of Wall Street's secret contagious pathology, with insiders like Lloyd
Blankfein, Henry Paulson and others pocketing billions more of the firm's
profits than shareholders, evidence the new "mutant capitalism" has
replaced Adam Smith's 1776 version which historically endowed the soul of American
democracy as well as our capitalistic system. Sadly for America Goldman's
disease is rapidly becoming a pandemic spreading beyond Wall Street's
too-greedy-to-fail banks, infecting our economy, markets and government as it
metastasizes globally...
Market
Reversal Already Happening ‘…First, the S&P sells on a
price-to-earnings multiple of 88 after the recent financial results. That is a
horrendous overvaluation. A reasonable p/e would be around 18-25. That leaves a
90 per cent downside! Secondly, the outlook for GDP growth is lackluster in
2010. It is therefore vulnerable to setbacks, and most particularly the impact
of a stock market decline that would undo much of the data pointing to a
recovery being in prospect. The market has been operating as a positive
feedback loop since March, it also works the other way around. Thirdly, have
markets not reached levels that would normally require a correction? Indeed,
have they not overshot those levels, and now require a bigger than average
correction?…’
.
5 DISTURBING FACTS FOR THE BULLS By Simon
Maierhofer
When seventeenth
century French dramatist Pierre Corneille said that 'danger breeds best on too
much confidence,' he wasn't talking about the stock market, but that doesn't
mean it doesn't have a practical application for investors.
On Wednesday,
October 21, 2009, the Volatility Index, also called the VIX or 'fear index',
fell to levels not seen in well over a year. In fact, the last time the VIX
dropped below Wednesday's reading of 20.10 was on August 28, 2009.
Just
a few days later the Dow Jones (DJI: ^DJI), S&P 500 (SNP: ^GSPC), and
Nasdaq (Nasdaq: ^IXIC) recorded mind boggling losses of about 30% in 30 days.
No doubt there is more to investing than just the VIX. Nevertheless, a look at
a composite of indicators shows that the party on Wall Street is close to an
end, or may have ended already.
DISTURBING
FACT NO. 1: BUYING CLIMAXES
Investors
Intelligence (II) tracks buying and selling climaxes on a weekly basis. Buying
climaxes take place when a stock makes a 12-month high, but closes the week
with a loss. They are a sign of distribution and indicate that stocks are
moving from strong hands to weak ones. According to II, investors who sell into
buying climaxes are right about 80% of the time after four months.
This
week, II recorded 253 buying climaxes and just 8 selling climaxes. The first
two weeks of October saw 597 buying climaxes and only 41 selling climaxes. In
total, there have been over 900 buying climaxes thus far in October, the most
since the October 2007 all-time highs.
DISTURBING
FACT NO. 2: DEFLATION
For
good reason, deflation is an economy's worst enemy. Falling prices create the
perception that any goods can be bought cheaper at a future time. This creates
a waiting attitude which stifles spending and demand, ultimately resulting in a
slower economy. A slower economy, on the other hand, forces consumers to turn
every penny twice before spending it.
In
September, the Producer Price Index (PPI) declined 0.6%. Even the core PPI,
which excludes food and energy, was down 0.1%. Even though investors seem more
concerned about inflation than deflation, it is deflation that has been showing
its ugly head. The 1929 onset of the depression shows what deflation can do.
This sad period of time came to be known as a deflationary depression.
DISTURBING
FACT NO. 3: FORECLOSURES
Foreclosures
used to be mainly confined to low income areas. The most recent figures from
Zillow, however, reveals a concerning development. USNews reports that at the peak
of the market, the top third of the property value spectrum made up just 16% of
foreclosures. By July of this year, this most expensive segment of the market
accounted for 30% of home foreclosures.
Based
on future projections, this isn't just a flash in the pan type problem.
Foreclosures are expected to rise from about 2 million currently, to 6.5
million by 2011. This cancer-like spreading of foreclosures even into the prior
taboo-area of prime mortgages is directly correlated with a weak job market.
Not
only is the 'official' unemployment rate quickly closing in on the foreboding
10% number, the average length of time unemployed, or without a job, has just
reached an all-time record of 26 weeks or six months.
It
seems like the real estate market is more aware of the seriousness of the issue
than the stock market. While the S&P 500 (NYSEArca: SPY - News), Dow Jones (NYSEArca: DIA - News) and Nasdaq (Nasdaq: QQQQ - News) have all reached new highs recently,
real estate ETFs like the Vanguard REIT ETF (NYSEArca: VNQ - News), iShares Cohen & Steers Reality
Majors (NYSEArca: ICF - News), and SPDR Dow Jones REIT ETF (NYSEArca: RWR - News) are still trading significantly below
their respective September recovery highs.
DISTURBING
FACT NO. 4: OIL PRICES
The
performance correlation between stocks and oil is tough to explain for
proponents of the 'business as usual' notion. High oil prices are usually the
scapegoat for a faltering economy, as we saw last year. As oil (NYSEArca: USO - News) rose to never before seen highs
($147/barrel), stock prices were plummeting.
Earlier
this year in February , however, oil prices were hovering near lows of
$30/barrel. At that time, the average price of gas was below $2 gallon.
CNNMoney asked just recently: 'But how good did you feel about the economy back
then? Fears about a massive wave of big bank failures and another depression
were running rampant. So, cheaper oil and gas were little consolation.'
At
precisely that time, when fears of another depression were running rampant, the
ETF Profit Strategy Newsletter issued a Trend Change Alert predicting the
onset of the most powerful rally since the October 2007 highs. While many were
selling at the worst time, Profit Strategy subscribers started accumulating
high octane leveraged ETFs, which racked up double and triple digit gains,
since.
Earlier
in 2008, the ETF Profit Strategy Newsletter introduced the 'red
across the board scenario'; a scenario where all asset classes should move in
the same direction. For most of 2008, the direction was down; beginning in
March 2009, the direction was up.
The
only economic environment that has the power to link the performance of various
asset classes is a deflationary depression, such as the Great Depression. Aside
from a 50% monster rally from 1929-1930 where all asset classes shot up (sound
familiar) simultaneously, the predominant trend was down, down hard.
DISTURBING
FACT NO. 5: (OVER) VALUATION
As a
consumer, chances are you're always looking for the best deal. Why overpay if
you can get the same item at a lower price elsewhere, or later on? Who, for
example, would still pay the sticker price for a gas guzzling SUV like a Chevy
Tahoe or Ford Explorer? Nobody! Even if the car served you well while you owned
it, you know that its resale value would be sub-par at best.
If
you wouldn't overpay for a car, why would you overpay for stocks?
Stocks
are way overvalued; it just hasn't sunk in yet. Based on actual reported
earnings, the P/E ratio for the S&P 500 is 138. This means that a stock
sells for 138x its actual earnings. Of course, this is the average for the
S&P. Many companies, such as Alcoa, aren't even in positive earnings
territory. The earnings picture today is worse than it was in the year 2000
when dozens of tech companies (NYSEArca: XLK - News) with no earnings saw their stock prices
soar into triple digits.
Even
though stocks still trade 30% below their 2007 levels, dividend yields are
within reach of their all-time lows. Dividends reflect a company's ability to
share its profits with shareholders. Declining dividends are caused by
declining profits. Dividend yields can increase either by a falling stock price
or rising dividends.
In
March, dividends for the broad market spiked briefly above 4%, due to the
waterfall decline in stock prices. For a short time, the Select Sector
Financial SPDRs (NYSEArca: XLF - News) offered a juicy yield of nearly 10%.
With rising prices, dividends have dropped back down towards 2% for the broad
market and only 2.52% for XLF.
Investors
with an affinity for historical data know that the stock market has never
reached a true bottom unless dividend yields are driven sky-high by falling
prices, and P/E ratios are driven down to rock-bottom readings, also due to
falling 'P' (prices). Once this valuation reset happens, the market will give a
green signal for the next bull market.
Unfortunately,
this reset did not happen at the 2002 lows. It also didn't happen in March
2009, and we are certainly far away from those levels with the Dow around
10,000 and P/E ratios of 138.
The
October issue of the ETF Profit Strategy Newsletter
includes a detailed analysis of P/E ratios, dividend yields, and two other
indicators; mutual fund cash levels and the Dow measured in the only true
currency - gold (NYSEArca: GLD - News). Since its 1999 peak, the gold-Dow has
spearheaded the decline to new lows. If history's assessment of valuation is
correct, the dollar-Dow will soon follow.
Confidence,
reflected by the elevated investor optimism (a contrarian indicator) does not
only breed danger, it also provides opportunities for savvy investors that know
how to interpret the market's very own signals.
- MARK
BERN: It's pretty scary to me when even
companies that are significantly under-performing on revenue and earnings
are keeping up with those companies that performing well. I suspect that this
sort of action will end badly, with those companies that are undeserving
getting slaughtered when fundamentals start to matter again. It's really
kind of reminiscent of the good old dot com days when earnings didn't
really matter. All such improprieties do end. The dream will end and we
will all wake up hoping that we did pay attention to those silly things
like revenue growth and earnings after all.
- MARK ACE: This
is the most honest article I have read in along time, but there may be a few
reasons below the surface that are driving at least some of this insanity.
The charts and technicals suddenly look better to the computers doing the
trading as many of the big dips from last year have now fallen off of the
charts and stats.The ETF mania causes stocks to be grouped by industries
or indexes with little regard for individual performance or fundamentals
and ETF buying is now a market force.Pure greed is overriding too many
decisions with too many investors afraid of missing out and creating a
psychology of panic buying and still pushing some short sellers into
covering. However, I think a big driver is simply the notion
that cash is trash and so with the dollar diving holding any other asset
is a plus at the moment. Ultimately the falling dollar will cause other
problems costing investors dearly in purchasing power, but the gains look
good on paper and beat the losses possible from holding dollars and not
investing them. Unfortunately, there
are too many conflicting variables out there in the form of considerations
like:government interventions, herd mentality buying and selling, quick
moving currency valuations, artificial interest rates and potenial
inflation affecting investments decisions far more than individual
fundamentals of individual companies I used to be an avid DD guy, but have
now found it to be a waste of time.
The double dip has
begun.
Statistically, we
will see a rise in GDP in Q3 and in Q4. This is anticipated and meaningless data,
but the numbers will hit headlines.
In the real world,
the double dip has begun. Here is why - no one seems to be willing to pull
things together in one short argument, perhaps for fear of being bored by a
bull wearing green shoots. Simply put, all the core factors in driving an
economy upward are broken other than pundit comments talking about "it
must turn upward base on historical data." ..
Unemployment:
The reported unemployment number
is 9.8%; real unemployment is 20% if you include those who have stopped looking
and part time workers wanting to work full time. And the labor force
participation rate is at a 23 year low.
National
Income: Wages are falling
and work hours are stagnant, according to Friday's jobs report, and combine
these data with a shrinking work force and rising unemployment and you continue
to have a sharp downturn in national income.
Consumer
Spending: National income
drives consumer spending, which is contracting due not just due to falling
national income but rapidly contracting credit lines and a near 40% loss of
accumulated wealth in the property and equity markets. And while consumer
spending ostensibly is 70% of the economy, this includes spending on health care
- love those government statisticians - so contraction has an incredibly
outsized impact on consumer discretionary spending - luxury goods, travel,
restaurants, unnecessary goods, expensive goods - anything you can trade down
from to a lower level of price with equivalent functionality.
Credit
Contraction: The credit
contraction has been ferocious for consumers and small businesses as noted this
morning by uber analyst Meredith Whitney (one of my favorites) in the Wall
Street Journal. Depending on how you slice data, almost all increases in
consumer spending since either 2002-2003 or 1997 has been due to credit.
Trillions have been withdrawn and Ms. Whitney postulates another $1.5 trillion
dollars will disappear in the coming months due to banking caution and changes
in regulations. Given the total lack of credit to small business, and this
segment is 38% of GDP and 50% of new job creation, there cannot be a recovery
until credit begins to flow.
Zombie Banks:
Nothing has changed with
toxic assets and zombie banks - nothing, and even the IMF said this - and
another $1.5 trillion needs to be written down, at least. Just because these
assets are not in the headlines, and the Fed, the Treasury and the FASB faked
stress tests and changed accounting rules, this does not mean the banks are or
will be lending in a meaningful way in the near future. The Fed prints money,
the banks sit on it to shore up busted balance sheets.
Business Investment: There are too many factories around the world, too many
shopping malls an stores, too much commercial real estate - and at levels
beyond all historical norms or comparisons. The first several legs of a rebound
needed to absorb this capacity before we see any uptick in business investment
that materially helps the economy.
The End of
Stimulus: The buy gold and
build a bomb shelter types have been screaming about the Fed printing money -
what the Fed did was print enough money (they added a trillion to their balance
sheet) to replace what was lost in the shadow and real banking systems - but
not enough to replace what will be lost in the next 12-24 months. That being
said, there is no political support for more stimulus. Deficits and a
Congressional election preclude another stimulus package next year and the Fed
and Uncle Sam have already said they are definitely pulling back, beginning
November 1. We saw what happened to auto sales after Cash for Clunkers ended;
ditto for home sales data in the coming weeks as the $8K tax credit expires.
The bottom line: the economy will be much on its own next year.
Corporate Earnings: Corporate earnings follow the economy and they may be all
right for Q3 and perhaps Q4 but they are going to disappoint the Street in
2010, big time. You can only cut costs so much - you need some top line growth -
and it is only going to be there next year.
Markets: And one historical norm I like is the regressing of
markets to the mean of corporate earnings. Translation - the market should be
coming down next year or perhaps in 2011.
What to Do:
If you like to short,
consider the following - short the S+P (puts on the SPY), long term; short
consumer discretionary spending via puts on the XLY; short the companies making
stuff know one needs, like Harley Davidson (HOG) and Brunswick (BC);
short companies making things no one can get credit to buy, such as new homes,
via puts on the XHB ETF; short business
spending via travel companies, the first thing to be cut in a business cutback,
via puts on Avis (CAR); short retailers with
terrible balance sheets, notably Macys (M).
Obama referred to Friday's
jobs data, a loss of 263,000 jobs (roughly 100,000 more than economists
expected) as sobering.
Well, I agree, but to say it was unexpected is to buy into those that thinks we
are in recovery phase. To me we are in the lull before the storm. By the way,
of over 80 economists surveyed, none, not one, predicted the number to be as
high as 263,000. That reality is sobering.
But if you really
want something sobering, I suggest the following link. As
the author points out, if you are expecting consumers to start spending more
money for an economic rebound then you are sadly mistaken. They are already
spending at very high (record) levels in terms of a percentage of personal
income and as a percentage of GDP. And even that is not really lifting us out
of this recession absent government support. Even though consumers are pretty
much spending as much as they can, the economy is still struggling. So I don't
expect things to improve from here.
And as this
piece points out, we are in for a world of hurt due to the size of the
private debt that has built up. We may do well in the short to medium term
while government spending/stimulus props us up, but that will in time end and
then we are all in for a world of hurt.
Now I hate
repeating myself so much, but let's consider the math and see where it leads us:
- The
unemployment rate is nearing a two decade high;
- Those with
jobs are working the these least number of hours per week ever (roughly
33);
- Adjusted
for inflation, hourly wages are at their lowest in three decades;
- Overall
debt, government and private, is at record levels;
- Foreclosures
are mounting on both a residential and commercial level;
- There
are an estimated 13 months worth of shadow inventory of houses, i.e. those
that will be for sale but are being held off the market for one reason or
another;
- When
closing costs are considered, nearly 50% of all homes are under water on
their mortgages;
- We
have now reached a record in terms of unemployed people who are staying
unemployed beyond their unemployment benefits;
- We
also have a record in terms of job availability for the unemployed with
job openings only there for one in six who are unemployed;
- Our
economy is over two thirds reliant on consumer spending, which is a
totally unsustainable model going forward;
- Financial
companies have doubled their GDP contribution in the past decade or so,
though it is now obvious that they are not adding any benefit to the
economy; and
- I am
tired of repeating all this bad news with seemingly no one paying
attention.
Folks,
I am not saying when the problems will sink in and take hold, but they have to
at some point. At the very best, our economy will be stagnant for years to
come, probably over a decade. More likely, in my opinion, we have a world of
hurt on the way with the only question in my mind being when will this reality
sink in?
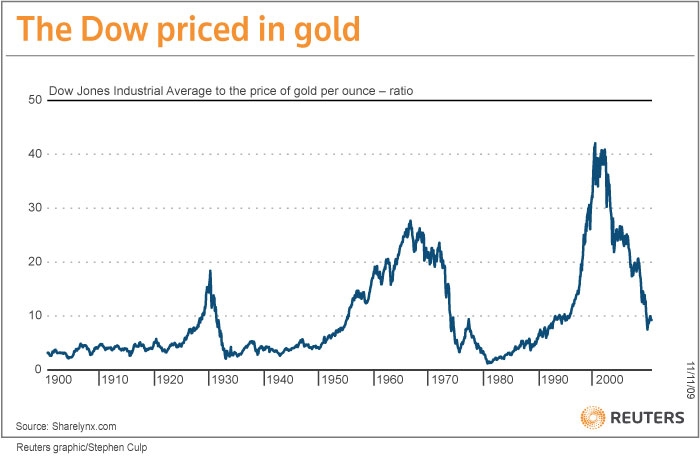
PREPARE
FOR A LOWER DOW TO GOLD RATIO…by Moses Kim – Seeking Alpha…That era of paper
wealth is gone for now, as evidenced by the mass failure of financial
institutions last fall, and we have entered into a period when hard assets are
in vogue. The Dow to Gold ratio is a useful tool to track this process of asset
reallocation, since gold is the ultimate hard asset. Usually, when hard assets
enter into a bull market, the Dow to Gold ratio goes to under 5. For example,
the ratio hit 1 in 1896, 2 in 1932, 3 in 1974, and 1 again in 1980. The current
bull market in gold has brought the ratio from a high of 44 in 1999, to its
current reading of 10. In addition, there seems to be a tendency for the ratio
to "overshoot" on the downside based on how overextended the ratio
becomes. For example, an 18 Dow:Gold ratio eventually fell to 2 in 1932, and a
27 Dow:Gold ratio eventually fell to 1 in 1980. Considering that the Dow:Gold
ratio was at 44 prior to this move, it looks like we still have a long way to
go on the downside… With stocks overpriced at over 100 times reported earnings,
a decent-sized pullback is in order. Therefore, I expect the Dow to Gold ratio
to decrease in the coming months and years…
CALPERS IS UNSUSTAINABLE
Jeff Nielsen The mainstream, U.S. media continue to ignore a
steadily worsening pension crisis, most likely because it is one more huge
contradiction of all their “U.S. economic recovery” propaganda. Unlike the $70
trillion or so in “unfunded liabilities” which is certain to bankrupt the U.S.
federal government – but not today, the U.S. pension-crisis is already here.
When the chief actuary of the nation's largest, state pension plan (CalPERS) bluntly states, “We are facing
decades...of...unsustainable pension costs”, this should have attracted the
attention of journalists across the U.S. Unfortunately, they all appear to be
much too busy handing out their “U.S. economic recovery” party-hats to be
paying attention. Some people may not see a direct connection between the
health of U.S. pension plans and the health of the overall economy, however the
connection is clear – and has never been greater than it is today. The huge,
demographic bulge known as “the baby-boomers” are beginning to retire. After
plundering government coffers for their entire lives by demanding exorbitant
social programs which they were unwilling to pay for with their own taxes, they
have literally mortgaged the futures of their own children and grand-children.
But the “plague” these “locusts” have inflicted on the U.S. economy goes well
beyond that. These are the same baby-boomers who dismantled the U.S.
manufacturing sector, and shipped it to Asia – so that they could pay less for
the ever-increasing hoard of consumer-goods which they have accumulated with
manic zeal. In the process, they have also eliminated most of the well-paying
jobs which they benefited from, but which they have taken away from their
children and grandchildren. Despite the baby-boomers having the best-paying
jobs of any generation in history, and ridiculously low taxes (relative to the
gold-plated social programs they demanded), these pampered prima donnas have
been so recklessly irresponsible with their own spending that this generation
has less in savings than previous generations. As a result, this bloc of
selfish spendthrifts is more dependent on lavish pensions (and pie-in-the-sky
medical benefits for seniors) than their own parents. The problem is that this
group has mismanaged their own pension-plans just as badly as they have
mismanaged the overall economy and government finances. In other words, just as
they have doing all their lives, U.S. baby-boomers are planning on spending
money they don't have all through their retirements – in order to fund their
lavish lifestyles. However, having squeezed all of the wealth out of the U.S.
economy, and squeezed all the wealth out of their children and grandchildren,
there is no money to top-up their mismanaged, under-funded pension plans (along
with the equally generous retirement medical plans which accompany them). The
bottom line is that this generation of financial-failures is already facing a
multi-trilllion dollar shortfall - which is totally separate from the $70
trillion funding-gap in Social Security and Medicare (see “U.S. Pension Crisis: the $3 TRILLION question”).
This is a crisis which is developing from the bottom up. Vallejo, the one-time
state capital of California, was already forced into bankruptcy due to the
unsustainable retirement benefit plans of its municipal workers. Meanwhile, on
the opposite coast, municipal leaders lament that they only have enough funds
to pay for either the pension/medical plans of their former police officers and
firefighters, or the salaries of the current police and firefighters. Further
aggravating this crisis at the local level, many municipal governments were
severely “burned” through being conned into various forms of “exotic financing”
by Wall Street scam-artists. Municipalities and public institutions not just in
the U.S., but all over the world, have been crippled by countless billions in
losses – while paying these financial predators fat fees to ruin them. It is
within this context that we can begin to examine the problems of the
pension-plans, themselves. To start with, the “financial model” (and solvency)
of most of these pension funds is based on the premise of a rate of return far
in excess of the historical, average rate of return in the U.S. economy. This
is despite the fact that the U.S.'s steadily growing mountain of
never-to-be-repaid debt requires an ever-greater percentage of the U.S.'s GDP
just to service the interest payments on this debt…
Is It a Stock Market Rally or a Dollar Devaluation Seeking
Alpha…A cheaper dollar means higher stock prices (temporaily), as US assets are
marked down for global investors. What we have is not a stock market rally but
an adjustment to global market prices. Fully 80% of the movement in the S&P
can be explained by the movement in the dollar index. That is a profile well
known to emerging market investors. Whenever the Brazilians would pull another
currency devaluation, stock prices rose to compensate, as tradeable assets
floated up to world market prices. The bank bailout has made Americans poorer
relative to the rest of the world and created the illusion of a stock market
recovery…
Wall Street was all in at the bottom, they caused the
reversal and resulting rally on declining volume, they held up the market all
on their own until institutional money managers fear ful of being accused of
missing the boat climbed aboard a few months later and now appear to be fully
invested, all that is left is for the fearful retail investor to be convinced
by Wall Street thats its safe for them to get on board as well. Based on Wall
Streets history for sacrificing the retail investor for the good of the market,
it seems that another black Oct is a forgone conclusion and then it starts all
over again. Aug 22 2009
Let me
put it this way, if the market goes down 50%, then goes up 50%, are you happy?
If that became a trend and happened 4 more times,
over say the next 3 years or so, you know what is left of your $1,000,000
investment?
Answer = $237,304
This
bull looks like BS to me. Low volume, high P/E. The market was oversold in
March and overbought now, but that doesn't mean it won't go higher or another
panic might not test the March lows. The important lesson for investors is that
you cannot time the market and must stay in the market to catch the upward
movements. Diversification is the key. Exposure to different asset classes,
including stocks, bonds, property, gold and cash. Don't be greedy.
Hypothetical scenario
start with $1 to invest in 1990 by 1999 you have
$2, now the dotcom bubble bursts your portfolio drops 50% and your left with
$1, back to square one, well then you hang in there and your investment grows
by 50% through 2008 so your up to $1.50, better then nothing though your only
up 50% in 2 decades, then we get the 2008 collapse down another 50% in 6 months
to $.75, so now your down 25% from your initial investment of $1 in 1990, but
wait if you can stay fully invested and all your positions move with the market
your up 50% in six months so you would now have $1.125 in your account, so
since 1990 your original investment of $1 has grown by 1/8 in just under 2
decades. Thats is reality for most investors and to think they dont know is
foolish and to think they will run back into the market again is also foolish,
without the Retail Pawns it will be hard for Wall Street to continue playing
the market manipulation game much longer
This
latest Bernanke-fueled rally confirmed--it's a pro market for technicians
driven by momentum based off Bernanke's cues. You can write the script--the
pro's drive another 300-500 points on the Dow, then small investors move in.
It's all good--until Jan/Feb/Mar. 2010 when consumer spending craters (then
back to Dow 8000) or when Israel bombs Iran (then back to Dow 6000).
I do not
know if this is a beginning of a bull or a bear. But, certainly, at these level
the US market is not a buy. Even in the positive scenario that the S&P
earns its 10 year average of 50 in 2010 it would stillbe a P/E of 20. Then
consider that the consumer will not return and that the government cannot
forever sustain its current cost to income ratio of 180% and you will have to
come to the conclusion to sell.
analysis try a qualitative analysis.
1. Volume is low over all and historically.
2. NDX typically leads any lasting rally,
3. The underlying economy is not likely to produce
the earnings projected (high probably multiple expansion is unwarranted).
4. The depth of the retraction into March was over
sized expect the bounces to be equally exotic.
5. The liquidity poured into the market is 7-10
times the amount seen in any other recession - where did it go beside bank
values? stocks.
6. Be patient and careful, momentum is fading the
market may be out of fuel.
As per Doug Short's great summary, it does not
mean the market cannot go higher temporarily - based on the momentum and
liquidity trading that is apparently happening - but it does clearly show that
the market is significantly overvalued by any historical comparisons with
previous recessions. Thus the only logical
conclusion is that (unless the market is somehow different this time-and it
never has been different before-despite bull and commentator claims to the
contrary) the market will endure at least one more very serious selloff at some
point in the relatively near future(or alternatively there will be some magical
hugh increase in corporate earnings, which is highly unlikely). Thus maybe one
can trade this market and make some money, but past historical comparisons
indicate there will be much better buying opportunites at much better
valuations somewhere out there in the relatively near future.
Was
there a Goldman Sachs in 1929-1932 with a direct dollar pipeline to the Fed?
Much of what we see today, IMO, is smoke and mirrors designed to make us feel
good. In today's America, feeling good is more important than reality. Or,
perhaps we believe feelings create reality. Japan has
languished because they refused to deal with their economic colapse according
to reality. Aren't we doing exactly the same? Did the investors who created
this mess lose their money? Not yet. But a lot of others have. Have the bad
loans been dealt with? Not yet. And we all know it. What has happened is the
Fed has pumped dollars into the "too-big-to-fail" companies (the
one's who should of lost it all) and the government has handed money to it's
citizens to "stimulate" things. Oh
yes, and the media has pumped persistently positive news to the citizens
designed to change moods rather than report fact. Bernanke thinks he has it figured out. That he can
engineer a graceful recovery and save the world. I think he's convinced has a
lot of new tricks up his sleave that will make it different this time. I'm just
afraid that his power is still inferior to the market's even though he has a
infinite number of dollars to play with.
And when the market decides to take over once
again, look out below.
By Simon Maierhofer August 27, 2009 …IF THERE
IS JUST ONE TIME YOU WANT TO TAKE A LESSON FROM HISTORY, IT IS RIGHT NOW. THE
PARALLELS BETWEEN TODAY AND THE GREAT DEPRESSION ARE NUMEROUS AND STRIKINGLY
SIMILAR. THIS 5-MINUTE HISTORY LESSON MIGHT BE THE BEST INVESTMENT YOU'LL EVER
MAKE.
WATCH OUT! EVEN THIS RALLY PARALLELS THE GREAT DEPRESSION
The first leg of the Great Depression reduced the Dow Jones (DJI:
^DJI) by 48%. The first leg of the 2007 bear market reduced the Dow Jones by
53%. Both times, the initial declines were followed by powerful and persistent
rallies. The five-month rally from November 1929 to April 1930, lifted the Dow
Jones (NYSEArca: DIA - News) by 49%. So far, the five month rally
from the March 2009 lows has lifted the Dow Jones by some 46%. The time frame
and percentage gains are certainly too close for comfort. Even though the
S&P 500 (SNP: ^GSPC) was not around during the Great Depression, the modern
day picture mirrors the Dow. The Nasdaq (Nasdaq: ^IXIC) may have already
provided a window into the future as it declined over 80% from its 2000
technology (NYSEArca: XLK - News) bubble, to its 2009 low. When talking
about windows for the future, we can't omit the juicy fact that the Dow Jones
measured in the only true currency - gold (NYSEArca: GLD - News) - has also declined to an extent similar
to the 1929 - 1932 market meltdown (more about that later).
FROM HUMOROUS TO SOBERING - PARALLELS THAT STING
Did you know that the Great Depression was preceded by a great
real estate boom centered in Florida? The Florida real estate bubble burst in
1926, three years before equities. Just as we've seen recently, investors took
their leftovers from the real estate bust and poured it into stocks. Talk about
jumping out of the frying pan into the fire. Just as in 2007, no one foresaw a
decline, let alone the seriousness of the decline. On December 4, 1928,
President Coolidge sent the following message on the state of the Union to the
reconvening Congress: 'No Congress of the United States ever assembled, on
surveying the state of the Union, has met with a more pleasing prospect than
that which appears at the present time. In the domestic field there is
tranquility and contentment and the highest record of years of prosperity. In
the foreign field there is peace. You may regard the present with satisfaction
and anticipate the future with optimism.'
JIM CRAMER - THE MODERN DAY HARVARD PARALLEL?
The Harvard Economic Society, previously esteemed for its
pessimism, turned bullish a few months before the market topped. In fact, the
Society remained bullish all throughout the downturn until it was dissolved
just before the depression ended. One of the many blunders that lead to the
untimely (though not soon enough for investors' welfare) demise of the Society,
was its March 24th, 1930 assessment that; 'The outlook is favorable.' This was
just days before the onset of the above mentioned second leg to new lows. The
second leg reduced the Dow by another 47%, but it didn't stop there. There are
many modern-day parallels to the Harvard Economic Society. The Blue Chip
Economic Indicator survey, a survey of private economists, is just one of them.
According to the survey, 90% of economists believe that the current recession
will be declared to have ended this quarter. Nobel-Prize-winning economist Paul
Krugman, who believes the worst of the global crisis is over, is likely to be
another one. Interestingly, economists also believed that in March 2009 the
market's worst was yet to come, when the Dow traded below 7,000. Contrary to
the general climate, the ETF Profit Strategy Newsletter's contrarian view
has been keeping subscribers one step ahead of the market.
REALISTS BEAT OPTIMISTS
In December 2009, the Newsletter declared Dow 9,000 to be an
opportunity to load up on short ETFs. This window of opportunity opened from
January 2nd to the 6th. In the following 90 days, short ETFs went to record
double and triple digit gains, while the S&P 500 (NYSEArca: IVV - News) lost 30%. On March 2nd, at a time when
an atmosphere of doom permeated Wall Street, the Newsletter issued a Trend
Change Alert with a target of Dow 9,000 - 10,000 and S&P (NYSEArca: SPY - News) 950 - 1,050. As the following excerpt
from John Kenneth Galbraith, author of 'The Great Crash 1929', observes;
contrarian (or realistic) investing pays big dividends. Before reading Mr.
Galbraith's astute assessment, take a moment to put it in context with today's
environment. Consider that the market just rallied about 50% from its
March lows and the worst seems to be over, while compelling values abound
(allegedly).' The worst continued to worsen. What looked one day like the end
proved on the next day to have been only the beginning. Nothing could have been
more ingeniously designed to maximize the suffering, and also to insure that as
few people as possible escape the common misfortune. The fortunate speculator
who had funds to answer the first margin call presently got another and equally
urgent one, and if he met that there would still be another. In the end all the
money he had was extracted from him and lost. The man with the smart
money, who was safely out of the market when the first crash came, naturally
went back in to pick up bargains. The bargains then suffered a ruinous fall.
Even the man who waited for volume of trading to return to normal and saw Wall
Street become as placid as a produce market, and who then bought common stocks
would see their value drop to a third or a fourth of the purchase price in the
next 24 months. The Coolidge bull market was a remarkable phenomenon. The
ruthlessness of its liquidation was, in its own way, equally remarkable.' Other
parallels that can be found are the government's assurance that things are
fundamentally sound, an increase in mergers and acquisitions, falling car
prices, increasing Ponzi schemes (Madoff vs Ponzi), new tools to leverage
money, credit expansion/contraction, etc. The Great Depression even had its own
Warren Buffett and Jim Cramer. If that isn't enough, consider this: Research
shows that the decline in industrial production over the last nine months has
been as bad, if not worse than the nine month following the 1929 peak. The
world stock markets have fallen even faster this time around compared to 70
years ago. The volume of world trade is drying up at a faster pace than the
Great Depression and government surpluses are the lowest in 100+ years.
RED ACROSS THE BOARD, NOT SEEN IN 70 YEARS
Thus far, this bear market has humbled large cap stocks
(NYSEArca: OEF - News)along with small cap stocks (NYSEArca: IWM - News), growth funds (NYSEArca: IWF - News) along with value funds (NYSEArca: IWD), defensive sectors along
with aggressive sectors, real estate (NYSEArca: ICF - News) along with commodities (NYSEArca: DBA - News). This unique 'red across the board'
behavior has not been seen in the 70s, 80s or 2000 bear markets. The only other
similar time period to be found is during the Great Depression. Of course you
can't simply build your entire financial future around parallels to past
history. If, however, such parallels as the ones discussed above, harmonize
with trustworthy indicators with an accurate historic record, the composite
advice should not be ignored. In fact, ignoring those indicators as a composite
would be a foolish thing to do. History has taught us that in periods of time
when investors are enthusiastic about stocks and their future prospects (1929,
2000, and 2007) has turned out to be the worst times to buy, and almost always
preceded a major market decline. The implications of the above mentioned
composite indicators will do more than merely touch peoples' financial futures.
Prudent investors will take precautions now to protect their family and
financial nest egg. The brand-new September issue of the ETF Profit Strategy Newsletter includes
an analysis of the current rally (are higher prices ahead or is a top in
place?), a target range for the ultimate market bottom, ETF profit strategies,
and practical ways to thrive and survive in the coming years. As mentioned
above, the Dow's recent decline measured in gold is a near replica of the 1929
- 1932 decline in stocks. Eventually, the Dow measured in inflated dollars will
catch up with the real value metrics reflected by gold. At that time, many will
wish they'd learned from history. We simply must learn from the mistakes
of others because you can't possibly live long enough to make them all
yourself.'
Fake Dutch 'moon
rock' revealed A treasured piece at the Dutch national museum - a supposed moon rock from the first manned lunar landing -
is nothing more than petrified wood,
...BBC News BBC NEWS | Europe | Fake Dutch 'moon
rock' revealed Prized
moon rock a fake - A PIECE of moon rock given to an overseas politician by
the United States is actually a lump of petrified wood, museum authorities
revealed yesterday. ... 'Moon Rock' in Dutch Museum Is Just Petrified
Wood Aug 27, 2009 ... Fake moon rock
at Dutch national museum. Rijksmuseum / AP. This rock,
supposedly brought back from the moon
by American astronauts, ... http://www.albertpeia.com/moonfraud.htm
From
TrimTabs Investment Research:
- selling
by U.S. corporate insiders in August surged to $6.1 billion, highest
amount since May 2008; the ratio of insider selling to insider buying hit 30.6,
the highest level since TrimTabs began tracking the data in 2004
- rally
supported by short covering — short interest on NYSE stocks plummeted by
10.3% in the second half of July
From
David Rosenberg of Gluskin Sheff:
- signs
of buyer fatigue appear to be emerging as signaled by the stock market’s
lukewarm reception to recent good news (increases in house prices/sales,
durable orders, and consumer confidence)
- 50%
gain in the S&P 500 since March has market trading at 130 times
trailing (reported) earnings
- Investors
Intelligence survey shows 51.6% respondents in the bullish camp with just
19.8% in the bear camp — market sentiment hasn’t been this “smug” since
the autumn of 2007 (right before the fall)
- weakest
periods of the year, September and October, just around the corner
- car purchases to retrench in U.S.
following end to cash-for-clunkers program
WHY THE BULLS ARE
SKATING ON THIN ICE Michael Panzner 9-10-09 Thursday,
we had more "good news" on the economic front. Another 550,000+
Americans filed initial jobless claims -- the 35th straight week above the
half-a-million mark.
As
usual, data that should be seen as a cause for concern seemed to be the
catalyst for renewed buying of equities, and the S&P 500 index climbed to
its highest level in six months -- up 54 percent since March 9th.
For
me, the current disconnect between Wall Street and Main Street brings back
memories of the fall of 2007, when share prices were racing to new highs as
credit markets were unraveling and the economy was imploding.
That
is not the only reason to think there is something wrong with this picture, of
course. The points raised in the following commentaries -- from Minyanville
and The Pragmatic
Capitalist, both of which are regular stopping points of mine --
also suggest the bulls are skating on very thin ice:
"Answers I Really Wanna Know: Is a Tech Wreck on the
Horizon?" (Minyanville):
If
technology stocks led the market higher and the semiconductors lead tech,
what can we read into...
Altera
(ALTR)
recently raised guidance and the stock was flat.
Diodes
(DIOD)
recently raised guidance and the stock was flat.
Microchip (MCHP)
recently raised guidance and the stock is flat.
Texas Instrument (TXN)
substantially raised guidance and the stock is up a dime.
Since Intel (INTC)
raised guidance on August 28th, the mother chip is .40 higher (and well below
the initial surge).
85% of portfolio managers are bullish on tech in a recent survey.
An ISI Group survey indicates 88% of respondents believe we’re in a
bull market.
"5 Reasons the Rally Is Built on Quicksand"
(The Pragmatic Capitalist):
From
the desk of David Rosenberg this morning [note: TPC's comments are in italics]:
1.
This remains a hope-based rally (with strong technicals). I say that because
during this six-month 50%+ rally in the S&P 500, the U.S. economy has shed
2.4 million jobs, which is almost as many as we lost during the entire 2001-02
tech wreck — in just six months. The market’s ability to shrug off the loss of
2.4 million jobs is either a sign that it is treating this as old news or sees
the cost-cutting as good news for profits. Either way, what we are seeing
transpire is without precedent — the magnitude of the employment slide versus
the magnitude of the market advance. Truly fascinating stuff.
It’s
remarkable to add that jobless claims were 550K this morning – a staggering
number this deep into a recession. But fear not – it was “better than expected”.
2.
Companies have not really been beating their earnings estimates — only the very
final estimates heading into the reporting quarter. For example, the consensus
view for 3Q EPS at the start of the year was $21.00, last we saw the estimates
were down to just over $14.00. But there is a deeply rooted belief that
earnings are coming in better than expected. This is a psychology that is
difficult to break. It is completely unknown (for some reason) that corporate
revenues are running at a -25% YoY rate, which compares to the -10% we saw at
the worst part of the 2001-02 bear market and the -3% trend at the most
negative point in 1991.
It’s
also interesting to note the very real weakness in corporate revenues. The
bottom line can be manipulated, but revenues never lie….
3.
Valuation is a poor timing device but even on “normalized” trailing 10-year
earnings, the S&P 500 is trading near 18x, which is now above the
historical average of 16x