When seventeenth century French dramatist Pierre Corneille said
that 'danger breeds best on too much confidence,' he wasn't talking about the
stock market, but that doesn't mean it doesn't have a practical application for
investors.
On Wednesday, October 21, 2009, the Volatility Index, also
called the VIX or 'fear index', fell to levels not seen in well over a year. In
fact, the last time the VIX dropped below Wednesday's reading of 20.10 was on
August 28, 2009.
Just a few days later the Dow Jones (DJI: ^DJI), S&P 500
(SNP: ^GSPC), and Nasdaq (Nasdaq: ^IXIC) recorded mind boggling losses of about
30% in 30 days. No doubt there is more to investing than just the VIX.
Nevertheless, a look at a composite of indicators shows that the party on Wall
Street is close to an end, or may have ended already.
DISTURBING FACT NO. 1: BUYING CLIMAXES
Investors Intelligence (II) tracks buying and selling climaxes
on a weekly basis. Buying climaxes take place when a stock makes a 12-month
high, but closes the week with a loss. They are a sign of distribution and
indicate that stocks are moving from strong hands to weak ones. According to
II, investors who sell into buying climaxes are right about 80% of the time
after four months.
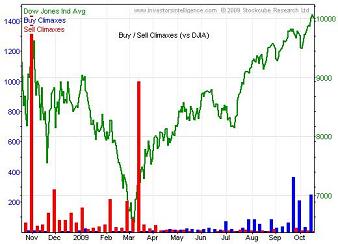
This week, II recorded 253 buying climaxes and just 8 selling
climaxes. The first two weeks of October saw 597 buying climaxes and only 41
selling climaxes. In total, there have been over 900 buying climaxes thus far
in October, the most since the October 2007 all-time highs.
DISTURBING FACT NO. 2: DEFLATION
For good reason, deflation is an economy's worst enemy. Falling
prices create the perception that any goods can be bought cheaper at a future
time. This creates a waiting attitude which stifles spending and demand,
ultimately resulting in a slower economy. A slower economy, on the other hand,
forces consumers to turn every penny twice before spending it.
In September, the Producer Price Index (PPI) declined 0.6%. Even
the core PPI, which excludes food and energy, was down 0.1%. Even though
investors seem more concerned about inflation than deflation, it is deflation
that has been showing its ugly head. The 1929 onset of the depression shows
what deflation can do. This sad period of time came to be known as a
deflationary depression.
DISTURBING FACT NO. 3: FORECLOSURES
Foreclosures used to be mainly confined to low income areas. The
most recent figures from Zillow, however, reveals a concerning development.
USNews reports that at the peak of the market, the top third of the property
value spectrum made up just 16% of foreclosures. By July of this year, this
most expensive segment of the market accounted for 30% of home foreclosures.
Based on future projections, this isn't just a flash in the pan
type problem. Foreclosures are expected to rise from about 2 million currently,
to 6.5 million by 2011. This cancer-like spreading of foreclosures even into
the prior taboo-area of prime mortgages is directly correlated with a weak job
market.
Not only is the 'official' unemployment rate quickly closing in
on the foreboding 10% number, the average length of time unemployed, or without
a job, has just reached an all-time record of 26 weeks or six months.
It seems like the real estate market is more aware of the
seriousness of the issue than the stock market. While the S&P 500
(NYSEArca: SPY - News), Dow Jones (NYSEArca: DIA - News) and Nasdaq (Nasdaq: QQQQ - News) have all reached new highs recently,
real estate ETFs like the Vanguard REIT ETF (NYSEArca: VNQ - News), iShares Cohen & Steers Reality
Majors (NYSEArca: ICF - News), and SPDR Dow Jones REIT ETF (NYSEArca: RWR - News) are still trading significantly below
their respective September recovery highs.
DISTURBING FACT NO. 4: OIL PRICES
The performance correlation between stocks and oil is tough to
explain for proponents of the 'business as usual' notion. High oil prices are usually
the scapegoat for a faltering economy, as we saw last year. As oil (NYSEArca: USO - News) rose to never before seen highs
($147/barrel), stock prices were plummeting.
Earlier this year in February , however, oil prices were
hovering near lows of $30/barrel. At that time, the average price of gas was
below $2 gallon. CNNMoney asked just recently: 'But how good did you feel about
the economy back then? Fears about a massive wave of big bank failures and another
depression were running rampant. So, cheaper oil and gas were little
consolation.'
At precisely that time, when fears of another depression were
running rampant, the ETF Profit Strategy Newsletter issued a Trend Change
Alert predicting the onset of the most powerful rally since the October 2007
highs. While many were selling at the worst time, Profit Strategy subscribers
started accumulating high octane leveraged ETFs, which racked up double and
triple digit gains, since.
Earlier in 2008, the ETF Profit Strategy
Newsletter introduced the 'red across the board scenario'; a scenario
where all asset classes should move in the same direction. For most of 2008,
the direction was down; beginning in March 2009, the direction was up.
The only economic environment that has the power to link the
performance of various asset classes is a deflationary depression, such as the
Great Depression. Aside from a 50% monster rally from 1929-1930 where all asset
classes shot up (sound familiar) simultaneously, the predominant trend was
down, down hard.
DISTURBING FACT NO. 5: (OVER) VALUATION
As a consumer, chances are you're always looking for the best
deal. Why overpay if you can get the same item at a lower price elsewhere, or
later on? Who, for example, would still pay the sticker price for a gas
guzzling SUV like a Chevy Tahoe or Ford Explorer? Nobody! Even if the car
served you well while you owned it, you know that its resale value would be
sub-par at best.
If you wouldn't overpay for a car, why would you overpay for
stocks?
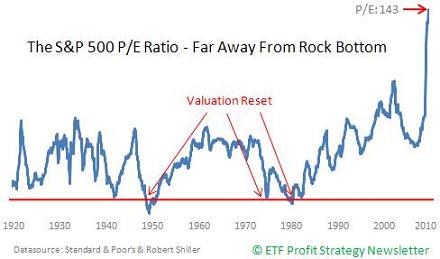
Stocks are way overvalued; it just hasn't sunk in yet. Based on
actual reported earnings, the P/E ratio for the S&P 500 is 138. This means
that a stock sells for 138x its actual earnings. Of course, this is the average
for the S&P. Many companies, such as Alcoa, aren't even in positive
earnings territory. The earnings picture today is worse than it was in the year
2000 when dozens of tech companies (NYSEArca: XLK - News) with no earnings saw their stock prices
soar into triple digits.
Even though stocks still trade 30% below their 2007 levels,
dividend yields are within reach of their all-time lows. Dividends reflect a
company's ability to share its profits with shareholders. Declining dividends
are caused by declining profits. Dividend yields can increase either by a
falling stock price or rising dividends.
In March, dividends for the broad market spiked briefly above
4%, due to the waterfall decline in stock prices. For a short time, the Select
Sector Financial SPDRs (NYSEArca: XLF - News) offered a juicy yield of nearly 10%.
With rising prices, dividends have dropped back down towards 2% for the broad
market and only 2.52% for XLF.
Investors with an affinity for historical data know that the
stock market has never reached a true bottom unless dividend yields are driven
sky-high by falling prices, and P/E ratios are driven down to rock-bottom
readings, also due to falling 'P' (prices). Once this valuation reset happens,
the market will give a green signal for the next bull market.
Unfortunately, this reset did not happen at the 2002 lows. It
also didn't happen in March 2009, and we are certainly far away from those
levels with the Dow around 10,000 and P/E ratios of 138.
The October issue of the ETF Profit Strategy Newsletter includes a
detailed analysis of P/E ratios, dividend yields, and two other indicators;
mutual fund cash levels and the Dow measured in the only true currency - gold
(NYSEArca: GLD - News). Since its 1999 peak, the gold-Dow has
spearheaded the decline to new lows. If history's assessment of valuation is
correct, the dollar-Dow will soon follow.
Confidence, reflected by the elevated investor optimism (a
contrarian indicator) does not only breed danger, it also provides
opportunities for savvy investors that know how to interpret the market's very
own signals.